Changelog
Latest updates and announcements for Composio.
Latest
Python SDK 0.18.0 hardens file uploads and provider schemas
Python SDK composio 0.18.0 closes URL-upload and telemetry exposure paths, aligns trigger creation with the current backend contract, and improves provider compatibility with modern tool schemas. All Python provider packages are also aligned at 0.18.0.
SDK versions
| SDK | Version |
|---|---|
Python composio | 0.18.0 |
File and telemetry security
FileUploadable.from_url()and Tool Router session-file imports now accept only HTTP(S) hosts whose resolved addresses are public. Redirects are rejected, and blocked inputs raiseBlockedInternalUrlError.- Error telemetry now applies best-effort redaction to error messages and stack traces before transport, covering URL queries, bearer and basic credentials, and recognized secret-like key-value pairs.
Trigger creation
triggers.create() now sends user_id to the backend rather than listing connected accounts in the SDK. When no connected_account_id is supplied, the backend selects the most recently created active connection for the user and toolkit. Self-hosted deployments need the backend version that supports this resolution.
Invalid trigger slugs now raise TriggerTypeNotFound. Omitting both user_id and connected_account_id, or passing blank values for both, raises InvalidParams. When the supplied user has no matching active connection, the backend upsert error now surfaces instead of the SDK raising NoItemsFound locally.
Provider and schema compatibility
- OpenAI provider tool-call handling now executes every call from the first assistant choice, including multiple calls returned in one response.
- Tool signature generation accepts list-valued JSON Schema types, unbounded
anyOfandoneOfoptions, and title-less top-level schemas. - LangChain, LangGraph, and AutoGen provider signatures now honor the configured
skip_defaultvalue. - The OpenAI Agents provider preserves valid array-item schemas instead of coercing type-less items to strings.
- Toolkit version pins are case-insensitive in both environment variables and user-provided mappings.
AutoGen dependency
Compatibility change
composio-autogen now depends on ag2 instead of the abandoned pyautogen package. Update dependency constraints or lockfiles that explicitly require pyautogen before upgrading.
TypeScript SDK 0.14.0 hardens file uploads and tool execution
TypeScript SDK @composio/core 0.14.0 closes file-upload and telemetry exposure paths, prevents duplicate tool side effects after retries, and aligns trigger creation with backend connection resolution.
SDK versions
| SDK | Version |
|---|---|
TypeScript @composio/core | 0.14.0 |
File and telemetry security
- URL file uploads and automatic uploads during tool execution reject private, loopback, link-local, carrier-grade NAT, and reserved addresses. Redirects are checked at every hop, and blocked requests raise
ComposioBlockedInternalUrlError. - Error telemetry redacts URL query strings, authorization credentials, and secret-like key-value pairs before transport.
- The package root exports
assertSafeFileUploadPath,isBlockedSensitiveFileUploadPath, andBUILTIN_FILE_UPLOAD_PATH_DENY_SEGMENTSso downstream packages can apply the same sensitive-file denylist.
Tool execution reliability
tools.execute()andtools.proxyExecute()no longer retry non-idempotent writes, preventing a timeout from repeating side effects such as sending the same email twice.OpenAIProvider.handleToolCalls()executes every tool call from the first assistant choice and returns one result for eachtool_call_idin deterministic order.- Provider tool schemas normalize duplicate JSON Schema
requiredentries before they are emitted.
Trigger and toolkit behavior
triggers.create() now sends user_id directly to the backend when connectedAccountId is omitted. This removes the extra connected-account lookup and lets the backend select the first active connection for the user and toolkit.
Behavior change
A missing or invalid connection now surfaces the backend upsert error instead of ComposioConnectedAccountNotFoundError. Self-hosted deployments need a backend version that resolves trigger connections from user_id.
Toolkit version pins are also case-insensitive in configuration objects and environment variables, so casing differences no longer fall back silently to latest.
Python SDK 0.17.1 adds session deletion
Python SDK composio 0.17.1 adds deletion to the Tool Router session lifecycle. This matches the TypeScript SDK surface released in @composio/core 0.13.1.
SDK versions
| SDK | Version |
|---|---|
Python composio | 0.17.1 |
Delete a session from the client or from the session itself:
composio.sessions.delete(session_id)

session.delete()Python SDK 0.17.0 makes sessions first-class
Python SDK composio 0.17.0 moves Tool Router onto a sessions-first API. It also adds webhook helpers and makes the current shared-connection ACL API easier to discover.
SDK versions
| SDK | Version |
|---|---|
Python composio | 0.17.0 |
Sessions and MCP
composio.sessions.create(...) is now the canonical sessions entry point. composio.create(...) and composio.use(...) remain supported shortcuts, while composio.tool_router is deprecated as an alias for the same object.
Sessions return native tools by default. Set mcp=True when a typed MCP session is required. The runtime object is unchanged, but the explicit option makes the MCP dependency visible in application code.
New APIs and behavior
triggers.parse()parses an incoming webhook request and can verify its signature. Passing an emptyverify_secretnow raises instead of silently skipping verification.triggers.set_webhook_subscription()creates or updates the project webhook subscription.connected_accounts.update_acl()is the primary shared-connection ACL patch helper.experimental.update_acl()remains as a deprecated alias.- Prefer
sandboxfor session code-execution configuration.workbenchremains an accepted alias.
TypeScript SDK 0.13.0 adds sessions and 0.13.1 adds deletion
TypeScript SDK @composio/core 0.13.0 makes the sessions API the primary way to work with Tool Router. Version 0.13.1 completes the lifecycle with session deletion.
SDK versions
| SDK | Version |
|---|---|
TypeScript @composio/core | 0.13.0 |
TypeScript @composio/core | 0.13.1 |
Sessions are first-class
Use composio.sessions.create() as the canonical entry point. composio.create() remains an alias. The shared-connection ACL helper also graduates to connectedAccounts.updateAcl(), while experimental.updateAcl() remains as a compatibility alias.
MCP is now opt-in at the type level. Sessions return native tools by default. Create a session with { mcp: true } before reading session.mcp in TypeScript.
import { Composio } from '@composio/core';

const composio = new Composio({ apiKey: 'your-api-key' });
const session = await composio.sessions.create('user_123', { mcp: true });

const mcp = session.mcp;
Other session and trigger updates
- Session responses expose the resolved workbench configuration. Prefer
sandboxfor code-execution configuration;workbenchremains an accepted alias. triggers.parse()parses incoming webhook requests and can verify their signatures.triggers.setWebhookSubscription()creates or updates a project webhook subscription.composio.sessions.delete(sessionId)andsession.delete()remove a Tool Router session in0.13.1.
TypeScript SDK 0.12.0 and Python SDK 0.16.0
This release improves failure handling on both SDKs. TypeScript callers can cancel a request rather than waiting for a slow network operation. Python fixes file handling, request timeouts, retry safety, and schema compatibility that could otherwise produce incorrect tool calls.
SDK versions
| SDK | Version |
|---|---|
TypeScript @composio/core | 0.12.0 |
Python composio | 0.16.0 |
TypeScript: request cancellation and ESM-only packages
Public TypeScript SDK methods accept a trailing { signal?: AbortSignal } request-options argument. Caller-initiated aborts are normalized to ComposioRequestCancelledError, including custom tools that cooperatively use SessionContext.signal.
Breaking change
The TypeScript SDK packages are ESM-only in 0.12.0. Use Node.js 22.22.3 or newer and ESM imports. The SDK no longer ships .cjs artifacts or its prior CommonJS compatibility layer.
Before:
const { Composio } = require('@composio/core');After:
import { Composio } from '@composio/core';The deprecated auth-config uuid response field was also removed. Use the canonical id field instead.
TypeScript improvements
authConfigs.list()addssearchandshowDisabledfilters.- Tool schema handling preserves and resolves internal
$defsand$refvalues for automatic file upload and download. - Custom tools correctly convert both Zod 3 and Zod 4 schemas to JSON Schema.
- The Anthropic provider sanitizes unsupported input-schema property names and restores the original tool arguments before execution.
Python fixes
- File fields hidden behind
$refor$defsare resolved before automatic upload and download handling. tools.execute()andtools.proxy()no longer retry non-idempotent writes, preventing duplicate side effects after timeouts, 429s, or 5xx responses.- Session file transfers and presigned S3 requests now use bounded connect and read timeouts, surfacing typed file errors rather than hanging.
- Provider tool schemas safely alias Python-invalid parameter names, preserve the original names for execution, and avoid mutating OpenAI Agents source schemas.
TypeScript SDK 0.11.0 moves custom tools to Tool Router
TypeScript SDK @composio/core 0.11.0 removes the old in-memory custom-tool registry. Custom tools now have one home: Tool Router sessions.
SDK versions
| SDK | Version |
|---|---|
TypeScript @composio/core | 0.11.0 |
Breaking change
Breaking change
composio.tools.createCustomTool(...) was removed. Because the SDK is still pre-1.0, this shipped as a minor release. Existing ^0.10.0 ranges do not upgrade to 0.11.0 automatically.
Before:
const tool = composio.tools.createCustomTool({ /* ... */ });After:
import { experimental_createTool } from '@composio/core';

const tool = experimental_createTool('GREP', {
  name: 'Grep Search',
  description: 'Search local files',
  inputParams: /* zod schema */,
  execute: async (input) => ({ input }),
});

await composio.create('user_123', {
  experimental: { customTools: [tool] },
});
Use experimental_createToolkit(...) when several local tools belong together. The experimental_* names are intentional: this API is still evolving.
Improvements and fixes
triggers.create()now forwardsuserId, enabling trigger 2FA ownership checks.- Telemetry sends no longer delay SDK results or rethrown errors.
- Automatic file handling now selects the correct branch for schemas that accept either one file or a list of files.
- Providers normalize model-produced JSON-string tool arguments and raise
ComposioInvalidToolArgumentsErrorfor invalid values instead of leaking raw parser errors. - MCP-backed toolkits with empty or missing output schemas no longer fail validation. Mastra also tolerates unresolved backend
$refvalues without making the whole tool list unusable.
Python SDK 0.15.0 supports trigger 2FA ownership checks
Python SDK composio 0.15.0 forwards user_id from triggers.create() to the trigger upsert request. This lets projects with trigger 2FA verify that the connected account belongs to the caller.
SDK versions
| SDK | Version |
|---|---|
Python composio | 0.15.0 |
No call-site migration is required. Pass user_id to triggers.create() when the trigger should be associated with a specific user.
PostHog connections: set your data region (US or EU) per connection
The PostHog region (us or eu) now lives on the connection instead of the auth config. Region is genuinely per-connection — different users can sit in different PostHog regions — so fixing it at the auth config forced everyone through one region. Each connection now carries its own.
You don't need to do anything. We migrated every existing connection with no re-auth: connections on the default (us) stay on us, and any that used another region such as eu keep that value.
Going forward
- Set
us(US Cloud) oreu(EU Cloud) on the connection. The host is built as<region>.posthog.com, so a full URL won't work and self-hosted PostHog isn't supported. - Link flow: the Region field appears when the user connects, prefilled with your default and editable.
- Initiate flow: you set the region, and the end user never sees it.
Setting a default on your auth config
An auth config's region default lives in its shared_credentials. If you were on the default (us), nothing was written there. To pin a region explicitly, set shared_credentials when you create an auth config, or patch an existing one.
See the PostHog toolkit docs for the current connection fields.
Python SDK 0.14.0 removes the legacy custom-tool registry
Python SDK composio 0.14.0 removes the legacy composio.tools.custom_tool registry. It was an older, separate custom-tool path that duplicated the Tool Router model and made it unclear which execution surface a tool belonged to.
SDK versions
| SDK | Version |
|---|---|
Python composio | 0.14.0 |
Breaking change
Breaking change
composio.tools.custom_tool, core.models.custom_tools, and their legacy execution wiring were removed. Use composio.experimental.tool() and composio.experimental.Toolkit with a Tool Router session instead.
The current custom-tool APIs support inline execution and Tool Router preload, attach, and reuse flows. They are the only custom-tool path supported by the SDK.
Migration
- Replace
@composio.tools.custom_toolwith@composio.experimental.tool. - Change the tool signature from a request object plus execution callback to
input, ctx. - Attach the tool when creating the session through
experimental.custom_tools.
Before:
from composio import Composio

composio = Composio()


@composio.tools.custom_tool
def add_two_numbers(request: AddTwoNumbersInput) -> int:
    return request.a + request.b
After:
from composio import Composio

composio = Composio()


@composio.experimental.tool
def add_two_numbers(input: AddTwoNumbersInput, ctx):
    return {"result": input.a + input.b}


session = composio.create(
    user_id="user_123",
    experimental={"custom_tools": [add_two_numbers]},
)
For a tool that calls a toolkit API, set extends_toolkit on the decorator and use ctx.proxy_execute(...) from the function body.
Security, API, and platform updates
A summary of recent security, API, and platform changes you may need to act on. Most won't apply to you, so skim for the ones that do. We are continuing to ship more.
Legacy MCP Config routes
- MCP requests now require an API key or
Authorization: Bearertoken. We recommend moving tocomposio.create
API Keys
- IP whitelisting, choose which ip address can work from your api keys.
- Scoped API Key are slowly being rolled out with first preset for
proxyExecute. You will be able to control what actions your api keys can take.
Proxy Execute
- Proxy Execute is disabled on
v3api, please usev3.1or update your sdks. - Proxy Execute is now an opt-in capability on an API key, it is a superset of regular capabilities + proxy execute.
- Proxy Execute requests have a 250MB payload cap.
Connections
- Connected-account tokens are redacted in API responses, for both Composio-managed and custom auth configs. Please use Proxy Execute instead. If you need this for some special case please reach out to support.
- Reiterating: Composio-managed OAuth connections are moving from
initiatetolink. The cutover for remaining organizations is July 3, 2026.
Workbench
- Code execution through the remote workbench (
COMPOSIO_REMOTE_WORKBENCH,COMPOSIO_REMOTE_BASH_TOOL) now runs only inside a Composio session. If your code execution stopped working, run it within a Composio session.
Webhooks
- Webhook URLs must be publicly reachable; internal and loopback targets are now rejected.
- Deliveries are now signed (verify the
webhook-signatureheader), and there is a newcomposio.trigger.disabledevent. Manage subscriptions with the Webhook Subscriptions API.
Rate limits
- Per-IP rate limits now apply; requests that exceed them receive
429responses.
Endpoints
- The legacy v1 and v2 endpoints, deprecated last year, have now been removed. Any calls to
/v1orv2endpoints now return410, please use the class ofv3andv3.1endpoints, if you need a guide to migration you can use this
Python SDK 0.13.1 adds experimental shared connections
Python SDK composio 0.13.1 adds experimental shared connected accounts. A shared connection can be pinned in a Tool Router session and used by another user_id only when its per-user ACL permits it.
SDK versions
| SDK | Version |
|---|---|
Python composio | 0.13.1 |
Shared connections
Create a shared connection with connected_accounts.link(..., experimental={...}), update its ACL with experimental.update_acl(...), and use the same experimental shape from session.authorize(...). connected_accounts.list() also accepts the PRIVATE, SHARED, and ALL account-type filters.
Shared connections are experimental. Their shape may change, so pin a specific SDK version if your application depends on the current API.
This release also fixes false-positive initiate() deprecation warnings for custom and non-OAuth auth configs, preserves null-only anyOf schema branches, and adds typed errors for invalid shared-connection operations.
New Endpoint: Revoke OAuth 2.0 Tokens for a Connected Account
You can now programmatically revoke a connected account's OAuth 2.0 tokens at the upstream provider, giving you explicit control over when credentials are killed at the third-party — instead of relying on deletion or natural token expiry.
The Endpoint
POST /api/v3.1/connected_accounts/{nanoid}/revokeOn success, the connection transitions to REVOKED and the response reports which token subjects were killed at the provider on this call.
Example request:
curl -X POST 'https://backend.composio.dev/api/v3.1/connected_accounts/ca_1a2b3c4d5e6f/revoke' \
  --header 'x-api-key: <YOUR_API_KEY>'
Example response (200 OK):
{
  "revoked_tokens": ["access_token", "refresh_token"],
  "connected_account": {
    "id": "ca_1a2b3c4d5e6f",
    "status": "REVOKED"
  }
}
The revoked_tokens array lists the subjects revoked at the provider during this call. An empty array means the connection was already in a revoked state and no upstream dispatch was issued.
Status Codes
| Code | Meaning |
|---|---|
200 | Connection revoked (or already revoked — see revoked_tokens) |
400 | Revoke is not supported for this toolkit |
404 | Connected account does not exist |
409 | Connection is not in a revokable state (only ACTIVE and already-REVOKED are accepted) |
500 | Server error — revocation could not be completed |
Revoke Is Not Automatic on Delete
Deleting a connected account or a project does not revoke tokens at the upstream provider — the credentials are removed from Composio but may remain live at the third-party until they expire naturally. If you need credentials killed at the provider, follow revoke-then-delete semantics: call POST /revoke first, then issue the delete.
Revoke Is Best-Effort
Some providers do not expose a programmatic way to revoke one or both token subjects (for example, an access token but no refresh-token revoke route, or no revoke endpoint at all). In those cases, Composio revokes whatever the provider supports and the revoked_tokens array reflects exactly what was killed. Always read revoked_tokens to confirm which subjects were affected — do not assume both access_token and refresh_token were revoked on every call.
Externally Revoked Tokens
If a user revokes the connection directly with the provider (for example, removing the app from their account on the provider's website), the upstream revoke call from this endpoint may return an error. Handle this case by treating the connection as already revoked on your side.
Session reuse, update, and connected accounts as arrays
Session reuse with composio.use()
composio.create() now returns a new session ID on every call, even for identical configs, for better isolation and observability. For multi-turn conversations, store the session ID and reuse it with composio.use():
from composio import Composio

composio = Composio()

# First request
session = composio.create(user_id="user_123")
session_id = session.session_id

# Subsequent requests
session = composio.use(session_id)
tools = session.tools()
Custom tools can also be attached when reusing a session. See Reusing a session and Custom tools.
Update session config with session.update()
Modify a session's toolkits, auth configs, connected accounts, and other settings without creating a new session. Only the fields you pass are changed:
session.update(
    toolkits=["gmail", "slack"],
    auth_configs={"gmail": "ac_new_config"},
)
See Updating a session.
connectedAccounts accepts arrays
connectedAccounts (TypeScript) and connected_accounts (Python) now accept an array of connected account IDs per toolkit. A single string is still accepted for backwards compatibility and is automatically coerced to an array.
session = composio.create(
    user_id="user_123",
    connected_accounts={
        "gmail": ["ca_work_gmail"],
    },
)
Only one account per toolkit is allowed when multi-account mode is disabled.
SDK versions
| SDK | Minimum version |
|---|---|
TypeScript @composio/core | 0.9.1 |
Python composio | 0.13.0 |
Sessions add preloaded tools and direct tools preset
Sessions now support preloading frequently used tools into session.tools() and
the session MCP tool list, so agents can call them without searching each time.
This works for Composio-managed tools, while SDK custom tools can be exposed
directly from session.tools() with preload: true.
Keep the preloaded set focused, generally fewer than 20 tools, to avoid context bloat.
SDK versions
| SDK | Minimum version |
|---|---|
TypeScript @composio/core | 0.9.0 |
Python composio | 0.13.0 |
from composio import Composio
from composio_openai_agents import OpenAIAgentsProvider

composio = Composio(
    api_key="your_api_key",
    provider=OpenAIAgentsProvider(),
)

session = composio.create(
    user_id="user_123",
    toolkits=["gmail"],
    preload={
        "tools": ["GMAIL_FETCH_EMAILS", "GMAIL_CREATE_EMAIL_DRAFT"],
    },
)

tools = session.tools()
print([tool.name for tool in tools])
# GMAIL_FETCH_EMAILS
# GMAIL_CREATE_EMAIL_DRAFT
# COMPOSIO_SEARCH_TOOLS
# ... other default meta tools
Direct tools preset
Specialized agents with a narrow tool set can use the direct tools preset to load every tool allowed by session filters into the session's tool list and disable session meta tools by default.
from composio import Composio, SESSION_PRESET_DIRECT_TOOLS
from composio_openai_agents import OpenAIAgentsProvider

composio = Composio(
    api_key="your_api_key",
    provider=OpenAIAgentsProvider(),
)

session = composio.create(
    user_id="user_123",
    toolkits=["gmail"],
    tools={
        "gmail": {
            "enable": ["GMAIL_FETCH_EMAILS", "GMAIL_CREATE_EMAIL_DRAFT"],
        },
    },
    session_preset=SESSION_PRESET_DIRECT_TOOLS,
)

tools = session.tools()
print([tool.name for tool in tools])
# GMAIL_FETCH_EMAILS
# GMAIL_CREATE_EMAIL_DRAFT
For agents that still need selected helper behavior, supported meta tool groups can be enabled alongside the preset:
from composio import Composio, SESSION_PRESET_DIRECT_TOOLS
from composio_openai_agents import OpenAIAgentsProvider

composio = Composio(
    api_key="your_api_key",
    provider=OpenAIAgentsProvider(),
)

session = composio.create(
    user_id="user_123",
    toolkits=["gmail"],
    tools={
        "gmail": {
            "enable": ["GMAIL_FETCH_EMAILS", "GMAIL_CREATE_EMAIL_DRAFT"],
        },
    },
    session_preset=SESSION_PRESET_DIRECT_TOOLS,
    manage_connections={"enable": True},
    workbench={"enable": True},
)

tools = session.tools()
print([tool.name for tool in tools])
# GMAIL_FETCH_EMAILS
# GMAIL_CREATE_EMAIL_DRAFT
# COMPOSIO_MANAGE_CONNECTIONS
# COMPOSIO_REMOTE_WORKBENCH
# COMPOSIO_REMOTE_BASH_TOOL
See Preloading tools, Direct tools preset, and Preloading custom tools for Python examples and full guidance.
SDKs: `link()` matches `initiate()` for the multi-connection guard
composio.connectedAccounts.link() (TypeScript) and composio.connected_accounts.link() (Python) now match the multi-connection guard that initiate() already had. With Composio-managed redirectable-OAuth callers being migrated off POST /api/v3/connected_accounts onto POST /api/v3/connected_accounts/link, the guard moves with them — so the migration doesn't quietly drop the duplicate-connection check.
Behavior change
Before: link() would happily create a second ACTIVE connection for the same (user_id, auth_config_id) pair without checking for an existing ACTIVE connection first.
After: link() first calls connectedAccounts.list({ userIds, authConfigIds, statuses: ['ACTIVE'] }). If any active connection exists, link() throws ComposioMultipleConnectedAccountsError unless the caller passes allowMultiple: true (TypeScript) / allow_multiple=True (Python).
SDK versions (patch releases)
| Package | Previous | This release |
|---|---|---|
TypeScript @composio/core | v0.8.0 | v0.8.1 |
Python composio | v0.12.0 | v0.12.1 |
Migration
Most callers don't need to do anything — link() raised an unrelated error or succeeded by accident in the duplicate-connection case before, and now raises a typed error you can handle. Two scenarios that need attention:
1. You intentionally create multiple connections per (user, auth_config) — for example, two Gmail accounts for the same user. Opt in:
connection_request = composio.connected_accounts.link(
    user_id="user_123",
    auth_config_id="ac_xxx",
    alias="work-gmail",
    allow_multiple=True,
)
Pair with a session-level multiAccount / multi_account config so the agent can disambiguate at execution time. See Managing multiple connected accounts for the session shape.
2. You're migrating from initiate() to link() as part of the Composio-managed OAuth migration. Pass allow_multiple / allowMultiple through unchanged — same flag name, same default (False), same exception (ComposioMultipleConnectedAccountsError).
Why
The migration changelog moves callers off connected_accounts/create onto /link. initiate() had allow_multiple and the duplicate-connection check; link() didn't. Without this fix, every customer who migrates would silently lose the guard and start creating duplicate ACTIVE connections on auth configs that were never meant to hold more than one. This release closes that gap.
SDKs add sandbox compute tier for Tool Router workbench
The Composio SDKs now let you pick the compute tier of the sandbox when creating a Tool Router session. Heavier code execution and larger in-memory data benefit from a bigger sandbox.
| Tier | vCPU | RAM |
|---|---|---|
standard | 1 | 1 GB |
medium | 2 | 2 GB |
large | 4 | 4 GB |
xlarge | 8 | 8 GB |
The field is optional and defaults to standard server-side when omitted, so existing code keeps working unchanged.
Pricing: Sandboxes are not billed today. Composio plans to begin billing for sandbox usage soon (metered by tier and runtime). Pick a tier that matches your workload — but expect future pricing to track actual usage.
SDK versions (patch releases)
| Package | Previous | This release |
|---|---|---|
TypeScript @composio/core | v0.8.0 | v0.8.1 |
Python composio | v0.12.0 | v0.12.1 |
Usage
TypeScript (camelCase on the SDK surface):
import { Composio } from '@composio/core';
const composio = new Composio({ apiKey: process.env.COMPOSIO_API_KEY! });

const session = await composio.create('user_123', {
  workbench: {
    enable: true,
    sandboxSize: 'large',
  },
});
The SandboxSize literal type and SandboxSizeSchema zod enum are exported from @composio/core.
Python (snake_case throughout):
session = composio.create(
    user_id="user_123",
    workbench={
        "sandbox_size": "large",
    },
)
The SandboxSize literal alias is available at composio.core.models.tool_router.SandboxSize.
Updating an existing session
Calling session.update() (or the equivalent PATCH /api/v3/tool_router/sessions/{id}) with a different sandbox_size recreates the sandbox on next access. The sandbox's in-memory filesystem state is lost, but the persistent /mnt/files/ mount survives the restart.
See Configuring Sessions → Sandbox compute tier for the full reference.
Webhook Triggers V2
Webhook Triggers V2 introduces a first-class webhook_endpoints resource with a dedicated ingress URL per OAuth app. V2 is opt-in and scoped to new trigger slugs — existing V1 triggers, URLs, and payload formats are unchanged.
Summary
| Change | Action required |
|---|---|
New webhook_endpoints API | None (opt-in) |
New ingress path /api/v3.1/webhook_ingress/{toolkit}/{we_*}/trigger_event | None (opt-in) |
| Ingress-level signature verification | Automatic for V2 endpoints |
New Slack V2 slugs (SLACK_CHANNEL_MESSAGE_RECEIVED, SLACK_DIRECT_MESSAGE_RECEIVED, SLACK_MESSAGE_REACTION_ADDED) | Opt-in |
| V1 ingress path and all legacy trigger slugs | None — unchanged |
What's in V2
Dedicated endpoint per OAuth app. Each webhook_endpoint is keyed by (toolkit_slug, project_id, client_id) and exposes its own URL containing a random we_* identifier:
https://backend.composio.dev/api/v3.1/webhook_ingress/{toolkit}/{we_xxx}/trigger_eventThis replaces V1's shared /handle URL per toolkit. Events arriving on a V2 URL are fanned out only to trigger instances on that endpoint's project.
Signature verification at ingress. Composio cryptographically verifies every V2 request against the signing secret stored on the endpoint, using HMAC-SHA256, Ed25519, or shared-token matching depending on the toolkit. Unsigned or tampered payloads are rejected, so third parties cannot spoof events onto your triggers. For providers that sign a request timestamp (e.g. Slack), replay protection additionally rejects requests whose timestamp falls outside the allowed skew window.
Per-user authorization for app-level events. On toolkits with per-user visibility — Slack being the first — V2 uses an app-level token (for Slack, an xapp-… token with authorizations:read) to resolve which connected users are authorized for a given event, so only those users' triggers fire. This underpins a new class of triggers for private channels, direct messages, and other per-recipient events, each routed only to the user the event was intended for.
Automatic handshakes and cleanup. Composio responds to provider verification challenges — Slack url_verification, Asana X-Hook-Secret, Outlook validation tokens, and so on — so callback URLs verify without any custom code. User-level webhooks are also deregistered on the provider side when the trigger is deleted.
API reference
All endpoints require a project API key (x-api-key).
| Method | Path | Purpose |
|---|---|---|
GET | /api/v3.1/webhook_endpoints/schema?toolkit_slug={slug} | List required setup fields for a toolkit |
POST | /api/v3.1/webhook_endpoints | Create an endpoint (idempotent per toolkit_slug + client_id within a project) |
GET | /api/v3.1/webhook_endpoints | List endpoints in the current project |
GET | /api/v3.1/webhook_endpoints/{id} | Get a single endpoint, including verified_at |
POST | /api/v3.1/webhook_endpoints/{id} | Replace setup_data |
PATCH | /api/v3.1/webhook_endpoints/{id} | Update one or more fields in setup_data |
Provider events are posted to:
| Method | Path |
|---|---|
POST | /api/v3.1/webhook_ingress/{toolkit_slug}/{webhook_endpoint_nano_id}/trigger_event |
Migration walkthrough (Slack)
Slack is the first toolkit on V2. The same flow applies to every toolkit added later.
1. Discover required fields
curl "https://backend.composio.dev/api/v3.1/webhook_endpoints/schema?toolkit_slug=slack" \
  -H "x-api-key: YOUR_API_KEY"
Sample response:
{
  "toolkit_slug": "slack",
  "setup_fields": {
    "webhook_signing_secret": {
      "display_name": "Signing Secret",
      "description": "Webhook request signing secret from your Slack app dashboard",
      "is_required": true,
      "is_secret": true
    },
    "app_token": {
      "display_name": "App-Level Token",
      "description": "Slack xapp- token with authorizations:read scope for event authorization",
      "is_required": true,
      "is_secret": true
    }
  }
}
2. Create the endpoint
curl -X POST "https://backend.composio.dev/api/v3.1/webhook_endpoints" \
  -H "x-api-key: YOUR_API_KEY" \
  -H "Content-Type: application/json" \
  -d '{ "toolkit_slug": "slack", "client_id": "YOUR_SLACK_CLIENT_ID" }'
Sample response:
{
  "id": "we_abc123",
  "toolkit_slug": "slack",
  "client_id": "YOUR_SLACK_CLIENT_ID",
  "webhook_url": "https://backend.composio.dev/api/v3.1/webhook_ingress/slack/we_abc123/trigger_event",
  "data": null,
  "created_at": "2026-04-24T10:00:00.000Z"
}
Hold on to two values from the response: id (used as ENDPOINT_ID in the next steps) and webhook_url (the URL you'll paste into your Slack app dashboard in step 5). The call is idempotent — calling it again with the same toolkit_slug and client_id returns the existing endpoint.
3. Store the signing secret
curl -X PATCH "https://backend.composio.dev/api/v3.1/webhook_endpoints/ENDPOINT_ID" \
  -H "x-api-key: YOUR_API_KEY" \
  -H "Content-Type: application/json" \
  -d '{ "data": { "webhook_signing_secret": "YOUR_SIGNING_SECRET" } }'
Store the signing secret before switching the provider's callback URL. If Slack posts to a V2 URL without a secret available, every request fails with 400 and Slack may auto-disable the endpoint after ~36 hours of failures.
4. Add an app-level token for private-scope events
The app-level token is what lets Composio resolve per-user authorization for Slack's private-scope events.
SLACK_DIRECT_MESSAGE_RECEIVEDalways requires it.SLACK_CHANNEL_MESSAGE_RECEIVEDrequires it for events from private channels and multi-person DMs; public-channel messages are delivered without it.
Skip this step if you only need public-channel messages today — you can add the token later.
curl -X PATCH "https://backend.composio.dev/api/v3.1/webhook_endpoints/ENDPOINT_ID" \
  -H "x-api-key: YOUR_API_KEY" \
  -H "Content-Type: application/json" \
  -d '{ "data": { "app_token": "xapp-..." } }'
Generate the token from Slack app → Basic Information → App-Level Tokens with scope authorizations:read.
5. Point your Slack app at the V2 URL
Set Event Subscriptions → Request URL in your Slack app to the webhook_url returned in step 2. Composio verifies the endpoint with Slack automatically — no extra action needed on your side.
6. Create V2 trigger instances
Three new Slack triggers go live on V2 today, with more to follow on V2 — both for Slack and for other toolkits. The table below maps your existing V1 slugs to the new V2 equivalents:
| V1 slug (still supported) | V2 replacement | app_token required? |
|---|---|---|
SLACK_RECEIVE_MESSAGE | SLACK_CHANNEL_MESSAGE_RECEIVED | Only for private channels and multi-person DMs; public channels work without it |
SLACK_RECEIVE_DIRECT_MESSAGE | SLACK_DIRECT_MESSAGE_RECEIVED | Always |
SLACK_REACTION_ADDED | SLACK_MESSAGE_REACTION_ADDED | Always (reactions don't carry channel type, so per-user authz runs unconditionally) |
curl -X POST "https://backend.composio.dev/api/v3.1/trigger_instances/SLACK_CHANNEL_MESSAGE_RECEIVED/upsert" \
  -H "x-api-key: YOUR_API_KEY" \
  -H "Content-Type: application/json" \
  -d '{
    "connected_account_id": "CONNECTED_ACCOUNT_ID",
    "trigger_config": {}
  }'
Heads up: OAuth apps are project-scoped on V2
Action required if you share a single OAuth app across multiple Composio projects or organizations today. V2 ties each OAuth app (client_id) to exactly one project. Before moving such an app to V2, either consolidate to a single project or register separate OAuth apps per project.
The provider dashboard accepts only one callback URL per OAuth app, and each V2 URL resolves to exactly one project — so a single OAuth app cannot feed multiple projects on V2.
The signing secret also lives on the endpoint, so the reverse holds too: two different OAuth apps cannot share one V2 endpoint — Composio only verifies signatures against the secret stored on that endpoint, so requests signed by a different OAuth app would be rejected.
In return, every project graduates to a first-class webhook tenant on V2 — with its own:
- Ingress rate-limit and backpressure budget
- Clean fan-out — events reach only that project's trigger instances
- Signing secret and app-level token, scoped to this project alone
- Per-project metering and billing
Your V1 endpoints are unaffected. Any OAuth app you leave on V1 continues to work across projects exactly as it does today.
Backward compatibility
Everything you have today keeps working — same URLs, same trigger slugs, same payload shapes, no data migration.
- The V1 ingress URL (
/api/v3/trigger_instances/{toolkit}/{project_id}/handle) is not deprecated. - Every existing trigger slug —
SLACK_RECEIVE_*,SLACKBOT_*, and the equivalent legacy slugs on other toolkits — continues to route through V1.
You only need to set up a V2 webhook endpoint in two cases:
- You want to use one of the new V2 trigger slugs (e.g.
SLACK_CHANNEL_MESSAGE_RECEIVED,SLACK_DIRECT_MESSAGE_RECEIVED). A V2 endpoint is required at setup; without one, the upsert returns400. - You want to move an OAuth app that's currently shared across multiple projects or organizations onto V2. Pick the project that should own it on V2 and set up an endpoint there, or register separate OAuth apps per project (see Heads up: OAuth apps are project-scoped on V2).
Even outside these two cases, we recommend moving your OAuth apps to V2 at your own pace. Every endpoint you migrate inherits the signature verification, ingress isolation, and per-user authorization called out above.
SDKs remove legacy automatic file handling config
The Composio SDKs no longer accept the legacy flags that previously controlled automatic file upload and download during tool execution. Automatic handling of file_uploadable fields stays off by default; you opt in with the explicit dangerously* option only.
Breaking change
Those legacy properties are removed from the public constructors and config types. Code that still passes them must migrate. Anyone who relied on the old default-on behavior (no file flag in the constructor) must now explicitly set the dangerously* flag to true to keep automatic path/URL file handling.
SDK versions (minor releases)
| Package | Previous | This release |
|---|---|---|
TypeScript @composio/core | v0.6.11 | v0.8.0 |
Python composio | v0.11.6 | v0.12.0 |
Other @composio/* npm packages that depend on core are published as patch bumps in the same release train (via the changesets updateInternalDependencies: "patch" setting) so they pick up the updated ComposioConfig surface — they have no public-API changes of their own.
Migration
Earlier SDK versions treated automatic file upload/download for file_uploadable tool fields as on by default (TypeScript: autoUploadDownloadFiles defaulted to true when unset; Python followed the same idea for auto_upload_download_files in prior releases). That default is now off. If you still want that behavior, you must explicitly set dangerouslyAllowAutoUploadDownloadFiles: true (TypeScript) or dangerously_allow_auto_upload_download_files=True (Python).
TypeScript — before (legacy):
// If you omitted autoUploadDownloadFiles, it used to default to true
new Composio({
  apiKey: process.env.COMPOSIO_API_KEY!,
});

// Equivalent when you set it explicitly:
new Composio({
  apiKey: process.env.COMPOSIO_API_KEY!,
  autoUploadDownloadFiles: true,
});
TypeScript — going forward (set true to match either legacy pattern above):
new Composio({
  apiKey: process.env.COMPOSIO_API_KEY!,
  dangerouslyAllowAutoUploadDownloadFiles: true,
});
To leave automatic file handling off (new default), omit dangerouslyAllowAutoUploadDownloadFiles or set it to false.
Python — before (legacy):
# If you omitted auto_upload_download_files, it used to default to True (prior releases)
Composio(api_key="...")

# Equivalent when you set it explicitly:
Composio(api_key="...", auto_upload_download_files=True)
Python — going forward (set True to match either legacy pattern above):
Composio(api_key="...", dangerously_allow_auto_upload_download_files=True)If you construct ToolRouterSession directly (unusual), the keyword argument is now dangerously_allow_auto_upload_download_files instead of auto_upload_download_files.
Local paths must live inside an allowlisted directory
Even with dangerouslyAllowAutoUploadDownloadFiles enabled, the SDK will only auto-upload local file paths that resolve inside an allowlisted directory. Paths outside the allowlist are rejected with ComposioFileUploadPathNotAllowed (TypeScript) / FileUploadPathNotAllowed (Python) before any file is read or sent.
This is a behavior change. Earlier SDK versions had no allowlist: any local path the legacy default-on flag saw was uploaded.
Default allowlist:
fileUploadDirs value | Effective allowlist |
|---|---|
omitted / undefined | [ <home>/.composio/temp ] (default staging dir) |
false | [] — all local paths rejected (URLs and File objects still work) |
[] | [] — same as false; explicit "no local paths" |
[<dir1>, <dir2>, …] | exactly those directories (replaces the default; ~ is expanded, paths are realpath-resolved, comparison is on a path-component boundary) |
URLs (http://… / https://…) and JavaScript File objects are not subject to the allowlist — only local string paths are.
TypeScript:
// Match the *broadest* legacy behavior: auto-upload on, allowlist widened to
// the directories your code actually reads from. Set this scope as tightly
// as you can — every path inside these dirs becomes uploadable to Composio.
new Composio({
  apiKey: process.env.COMPOSIO_API_KEY!,
  dangerouslyAllowAutoUploadDownloadFiles: true,
  fileUploadDirs: ['/srv/uploads', '~/data/inbox'],
});

// Disallow local-path uploads entirely; the SDK will only stage URLs and
// File objects, and reject string paths outright.
new Composio({
  apiKey: process.env.COMPOSIO_API_KEY!,
  dangerouslyAllowAutoUploadDownloadFiles: true,
  fileUploadDirs: false,
});
Python:
# Equivalent of the TypeScript example above.
Composio(
    api_key="...",
    dangerously_allow_auto_upload_download_files=True,
    file_upload_dirs=["/srv/uploads", "~/data/inbox"],
)

# Reject all local paths.
Composio(
    api_key="...",
    dangerously_allow_auto_upload_download_files=True,
    file_upload_dirs=False,
)
Manual staging (TypeScript only):
If you don't want to widen the allowlist, the TypeScript SDK lets you stage files yourself via composio.files.upload(...). That call bypasses the allowlist by design (the caller is expected to control the path), and the returned { name, mimetype, s3key } descriptor can be passed straight into tools.execute:
const staged = await composio.files.upload({
  file: '/anywhere/on/disk/report.pdf',
  toolSlug: 'GOOGLEDRIVE_UPLOAD_FILE',
  toolkitSlug: 'googledrive',
});

await composio.tools.execute('GOOGLEDRIVE_UPLOAD_FILE', {
  userId: 'user-1',
  arguments: { file_to_upload: staged },
});
The Python SDK does not currently expose a top-level manual-staging API; opt in with dangerously_allow_auto_upload_download_files=True and configure file_upload_dirs to cover the directories your code reads from.
What else changed
- TypeScript:
resolveAutoUploadDownloadFilesEnabledonly considersdangerouslyAllowAutoUploadDownloadFiles; the old deprecation warning for the legacy property is removed. - Python: the small
composio.utils.auto_upload_downloadhelper that merged legacy + new flags is removed;ToolsandToolRoutertake only the explicit opt-in boolean.
Documentation for executing tools and the TypeScript Composio reference is updated to describe defaults and the opt-in flag.
Link Auth Migration for Composio-Managed OAuth Connections
POST /api/v3/connected_accounts is being retired for Composio-managed OAuth connections. New organizations begin migrating on Friday, May 8, 2026, and all remaining organizations follow on Friday, July 3, 2026. Once migrated, affected requests receive 400 BadRequest with a message pointing at the replacement endpoint.
This does not affect custom auth configs (your own OAuth app) or non-OAuth schemes (API key, bearer token, basic auth, etc.) — those continue to work on POST /api/v3/connected_accounts unchanged. Only the specific combination of Composio-managed auth config + redirectable OAuth scheme (OAuth1, OAuth2, DCR_OAUTH) is moving.
Breaking Change (phased rollout)
If your integration calls POST /api/v3/connected_accounts for a Composio-managed OAuth1, OAuth2, or DCR_OAUTH auth config, it will start returning 400 BadRequest on the dates below. Migrate to POST /api/v3/connected_accounts/link before your organization's cutover.
- Friday, May 8, 2026 (00:00 UTC) — organizations created on or after this timestamp are blocked.
- Friday, July 3, 2026 (00:00 UTC) — all remaining organizations are blocked.
What's Changing
| Request | Before | After (once rollout reaches your org) |
|---|---|---|
POST /api/v3/connected_accounts, Composio-managed + OAuth1 / OAuth2 / DCR_OAUTH | Creates a connected account (redirect URL returned) | 400 BadRequest — use /link instead |
POST /api/v3/connected_accounts, custom auth config | Creates a connected account | Unchanged |
POST /api/v3/connected_accounts, API key / bearer / other non-OAuth | Creates a connected account | Unchanged |
POST /api/v3/connected_accounts/link | Creates a link session | Unchanged — the recommended path going forward |
Why
When a connection is initiated through a default (Composio-managed) auth config, a Composio-owned OAuth application is acting on behalf of your integration. We want the end user to explicitly understand and acknowledge, at the moment of connection, that they are granting a third-party application access to their account on the external service. That acknowledgement is enforced by the /link flow, which routes the user through a consent screen before the connection is created. The legacy POST /api/v3/connected_accounts path allowed that step to be bypassed when credentials were passed in directly, which this change closes.
Custom auth configs are unaffected because they are backed by your own OAuth application — the consent screen is served by your app, so you already own that experience. This change is scoped specifically to default auth configs on redirectable schemes, where the third-party relationship is with Composio rather than with the developer.
Migration
Before — legacy create (will be rejected for Composio-managed OAuth):
curl -X POST https://backend.composio.dev/api/v3/connected_accounts \
  -H "Content-Type: application/json" \
  -H "x-api-key: <YOUR_API_KEY>" \
  -d '{
    "auth_config": { "id": "ac_your_composio_managed_oauth_config" },
    "connection": { "user_id": "your_end_user_id" }
  }'
After — link session (recommended, works for all schemes including non-OAuth and custom):
curl -X POST https://backend.composio.dev/api/v3/connected_accounts/link \
  -H "Content-Type: application/json" \
  -H "x-api-key: <YOUR_API_KEY>" \
  -d '{
    "auth_config_id": "ac_your_composio_managed_oauth_config",
    "user_id": "your_end_user_id"
  }'
The response contains a redirect_url (valid for 10 minutes) that the end user opens to authorize the integration, plus a connected_account_id you can use to poll for status or associate with your own records.
Error Response (after rollout)
Requests that hit the retired combination receive:
{
  "error": {
    "code": "BadRequest",
    "message": "Creating connections on this endpoint for Composio-managed OAuth auth configs is no longer supported. Use POST /api/v3/connected_accounts/link instead.",
    "suggestedFix": "Call POST /api/v3/connected_accounts/link with the same auth_config_id and user_id to get a redirect URL for the end user."
  }
}
What to Do
- If you use Composio-managed OAuth auth configs (OAuth1, OAuth2, or DCR_OAUTH) via
POST /api/v3/connected_accounts: switch toPOST /api/v3/connected_accounts/linkbefore your org's cutover — Friday, May 8, 2026 for organizations created on or after that date, Friday, July 3, 2026 for all others. - If you already use
/link: no action required. - If you use custom OAuth apps (your own
client_id/client_secret) or non-OAuth auth (API key, bearer, etc.): no action required — the legacy endpoint continues to serve those cases.
Proxy execute now enforces same-domain endpoints
To prevent a connection's Authorization header from being forwarded to an unintended host, the proxy execute endpoint (POST /api/v3/tools/execute/proxy) now requires that the outbound endpoint URL share the same scheme and registrable domain (eTLD+1) as the connection's resolved base_url.
Cross-subdomain requests on the same registrable domain continue to work — for example, a Gmail connection with base https://gmail.googleapis.com can still call https://www.googleapis.com/.... Relative endpoints (/users/me/messages) are resolved against the connection's base_url as before and are unaffected.
Breaking Change
Existing proxy calls that pass an absolute endpoint URL whose registrable domain does not match the connection's base_url will now fail with 400 OriginMismatch instead of being forwarded. Calls that omit both connected_account_id and custom_connection_data will fail with 400 MissingAuthContext instead of being forwarded without auth.
Migration
If you currently pass an absolute URL that points at a different domain than your connection's base_url, switch to a relative endpoint (resolved against base_url) or an absolute URL under the same registrable domain.
Before — absolute URL on a different domain (will be rejected):
{
  "endpoint": "https://api.someservice.com/v1/items",
  "method": "GET",
  "connected_account_id": "ca_..."
}
After — relative endpoint (recommended):
{
  "endpoint": "/v1/items",
  "method": "GET",
  "connected_account_id": "ca_..."
}
Or — absolute URL on the same registrable domain as the connection's base_url:
{
  "endpoint": "https://uploads.someservice.com/v1/items",
  "method": "GET",
  "connected_account_id": "ca_..."
}
If your integration legitimately needs to call a different registrable domain for the same connection, reach out so we can add the additional host to the toolkit allowlist.
What changed
- Absolute
endpointURLs on a different registrable domain than the connection'sbase_urlare rejected with HTTP400 OriginMismatch. The upstream request is never made. - Proxy calls that provide neither
connected_account_idnorcustom_connection_datanow return HTTP400 MissingAuthContextinstead of being forwarded without auth.
Examples
Assume a connected account whose toolkit base_url is https://api.linear.app.
Allowed — relative endpoint:
curl -X POST https://backend.composio.dev/api/v3/tools/execute/proxy \
  -H 'x-api-key: <YOUR_API_KEY>' \
  -H 'Content-Type: application/json' \
  -d '{
    "endpoint": "/graphql",
    "method": "POST",
    "connected_account_id": "ca_..."
  }'
Allowed — same registrable domain (different subdomain):
{ "endpoint": "https://uploads.linear.app/...", "connected_account_id": "ca_..." }Rejected — different registrable domain:
{ "endpoint": "https://attacker.example/leak", "connected_account_id": "ca_..." }Response:
{
  "error": {
    "code": "OriginMismatch",
    "message": "Endpoint host does not match the connection's base_url host."
  }
}
What to do
- If you call proxy execute with absolute URLs, make sure the host matches (or is a subdomain of) the connection's
base_url. - Prefer relative endpoints (
/path) — they are resolved againstbase_urland are not affected by this change. - If your integration legitimately needs to span multiple registrable domains for the same connection, reach out to us so we can add the additional host to the toolkit allowlist.
SDK file upload hardening: sensitive path blocking and upload hooks
The Composio SDKs add defense-in-depth for automatic file uploads (when a tool input is marked file_uploadable and the SDK reads a local path and sends the file to Composio storage). The goal is to reduce the risk of agent or app code accidentally exfiltrating secrets, SSH keys, or project env files that sit under well-known paths on disk.
URLs and File objects are not subject to the path-based denylist in the same way as string paths; the checks apply to resolved local filesystem paths used for auto-upload and the programmatic upload helpers that accept paths.
SDK versions
| SDK | Version (includes this behavior) |
|---|---|
| TypeScript | @composio/core v0.6.11 or later |
| Python | composio v0.11.6 or later |
What changed
- Default sensitive path protection — Before reading and uploading, the SDK checks the resolved local path against a built-in list of path segments (for example
.ssh,.aws,.claude,.kube) and file-name patterns (for example.env, default SSH private key names,credentials). If the path matches, the upload is refused unless you change configuration. - Extra denylist segments — You can add path component names to merge with the built-in list (for example a proprietary secrets directory name).
beforeFileUpload/before_file_uploadhook — Optional hook for each file upload: return a different path, returnfalseto abort, or throw. TypeScript: passbeforeFileUploadon the third argument totools.execute. Python: use@before_file_uploadin themodifierslist (same as other Python modifiers), not a separate keyword. Use this to enforce app-specific policies, audit logging, or copy-on-write to a safe temp file before upload. See Before file upload (Python).- New errors —
ComposioSensitiveFilePathBlockedError/SensitiveFilePathBlockedErrorwhen a path is blocked, andComposioFileUploadAbortedError/FileUploadAbortedErrorwhen the hook returnsfalseor a hook throws in an aborting way. - Python: modifier order —
substitute_file_uploadsruns beforebefore_executemodifiers, matching TypeScript behavior (including Tool Routerexecute_meta).
Examples
Configure the client (defaults + extra denylist segments)
Keep the built-in blocklist enabled and add path component names (anywhere in the resolved path) that your app treats as secret:
import { Composio } from '@composio/core';

const composio = new Composio({
  apiKey: process.env.COMPOSIO_API_KEY!,
  sensitiveFileUploadProtection: true,
  fileUploadPathDenySegments: ['company-secrets', 'private-keys'],
});
Run a hook before each automatic file read
Return a new path, return false / False to abort, or throw. TypeScript passes beforeFileUpload in the third argument to tools.execute. In Python, use @before_file_upload in modifiers:
import { Composio, type beforeFileUploadModifier } from '@composio/core';
import path from 'node:path';

const composio = new Composio({ apiKey: process.env.COMPOSIO_API_KEY! });

const beforeFileUpload: beforeFileUploadModifier = async ctx => {
  // e.g. log, rewrite path, or return false to block
  return ctx.path;
};

await composio.tools.execute(
  'GOOGLEDRIVE_UPLOAD_FILE',
  {
    userId: 'user-123',
    arguments: { file_to_upload: path.join(__dirname, 'document.pdf') },
    dangerouslySkipVersionCheck: true,
  },
  { beforeFileUpload },
);
Opting out
Set sensitiveFileUploadProtection: false (TypeScript) or sensitive_file_upload_protection=False (Python) only if you have a clear reason and accept the security tradeoff. Prefer copying files to a non-sensitive path or using the hook to gate uploads.
import { Composio } from '@composio/core';

const composio = new Composio({
  apiKey: process.env.COMPOSIO_API_KEY!,
  sensitiveFileUploadProtection: false,
});
Where to read more
- Executing tools: automatic file handling and security options — configuration and code patterns.
- TypeScript
Composioclient — related constructor options in the reference. - TypeScript SDK (repository):
ts/docs/advanced/auto-upload-download.md— extended guide with error types and edge cases.
Webhook Event for Auto-Disabled Triggers
composio.trigger.disabled is a new V3 webhook event that fires when Composio disables one of your triggers without a request from you — expired credentials, a failed webhook-subscription refresh, or unhealthy polling. It's opt-in: add it to a webhook subscription's enabled_events to receive it. Existing subscriptions for composio.trigger.message and composio.connected_account.expired are unaffected.
When it fires
The event is emitted only for platform-initiated disables. data.disabled_reason names the cause:
disabled_reason | What it means |
|---|---|
connection_expired | The connected account entered EXPIRED and the trigger was paused. Auto-re-enabled when the account returns to ACTIVE. |
subscription_auth_failure | The provider rejected the credentials when Composio tried to refresh the webhook subscription. Re-auth the connection to resolve. |
subscription_refresh_failure | Composio could not reach the provider to refresh the webhook subscription (provider error, timeout, or network issue). Re-enable the trigger once the provider is healthy. |
polling_failure_in_composio_infra | Composio's polling service failed to fetch events for this trigger after repeated retries. Rare in practice. |
The event does not fire when you disable a trigger yourself — neither through PATCH /api/v3/trigger_instances/manage/{id} nor by deactivating the connected account via PATCH /api/v3/connected_accounts/{id}/status.
Subscribe
Add composio.trigger.disabled to your subscription's enabled_events — via the dashboard webhook settings or the Webhook Subscriptions API:
curl -X PATCH https://backend.composio.dev/api/v3/webhook_subscriptions/ws_your-subscription-id \
  -H "X-API-KEY: <your-composio-api-key>" \
  -H "Content-Type: application/json" \
  -d '{
    "enabled_events": [
      "composio.trigger.message",
      "composio.trigger.disabled"
    ]
  }'
The event is V3-only. Subscriptions on V1 or V2 payloads cannot enable it.
Payload
{
  "id": "msg_847cdfcd-d219-4f18-a6dd-91acd42ca94a",
  "type": "composio.trigger.disabled",
  "metadata": {
    "project_id": "pr_your-project-id"
  },
  "data": {
    "id": "ti_your-trigger-id",
    "connected_account_id": "ca_your-connected-account-id",
    "trigger_name": "GITHUB_COMMIT_EVENT",
    "user_id": "your-user-id",
    "trigger_config": { "owner": "composio", "repo": "hermes" },
    "disabled_at": "2026-04-23T11:59:59.000Z",
    "disabled_reason": "connection_expired"
  },
  "timestamp": "2026-04-23T12:00:00.000Z"
}
See subscribing to triggers for handler setup and subscribing to connection expiry events for re-auth flows on connection_expired.
Credential Redaction for Composio-Managed Auth Configs and Connections
Two related security changes are rolling out together:
- Connections on Composio-managed auth configs now always redact
access_token,refresh_token, and theAuthorizationheader inconnected-accountsresponses — independent of your project'smask_secret_keys_in_connected_accountflag. - Auth-config GET responses now redact (for Composio-managed) or mask (for customer-owned) every sensitive credential field.
Auth-config credential redaction is not controlled by mask_secret_keys_in_connected_account. That project flag only applies to runtime connected-account credentials (access tokens, refresh tokens, and the like). Auth-config credentials are developer-owned static fields — client_id, client_secret, developer_token, etc. — and are always redacted or masked regardless of the mask_secret_keys_in_connected_account project flag.
Most integrations need no changes.
- Tool execution through the SDK, Tool Router, and MCP is unchanged. Composio uses the unredacted values server-side.
- Connections on customer-owned auth configs continue to follow your project's
mask_secret_keys_in_connected_accountsetting for runtime tokens.
What is a Composio-managed auth config?
When you connect a user through a toolkit's default integration — for example, Gmail or Slack without registering your own OAuth application — Composio uses an OAuth application it owns and shares across every team on that default. Tokens the provider issues are bound to that shared Composio-owned client.
You can identify a Composio-managed auth config or connection by is_composio_managed: true on the auth-config or connected-account resource.
1. Connected-account tokens
Access tokens, refresh tokens, and all header and query-parameter values are now replaced with the literal string "REDACTED" for Composio-managed connections. No prefix, no suffix — nothing that reveals the underlying value.
Before, with mask_secret_keys_in_connected_account: false on a Composio-managed Gmail connection:
{
  "state": {
    "val": {
      "access_token": "ya29.a0ARrdaM9...full token...",
      "refresh_token": "1//04...full token..."
    }
  },
  "data": {
    "headers": {
      "Authorization": "Bearer ya29.a0ARrdaM9...full token..."
    }
  }
}
After:
{
  "state": {
    "val": {
      "access_token": "REDACTED",
      "refresh_token": "REDACTED"
    }
  },
  "data": {
    "headers": {
      "Authorization": "REDACTED"
    }
  }
}
Connections on customer-owned auth configs are unaffected — token visibility follows your existing mask_secret_keys_in_connected_account setting (xxxx... truncation when enabled, raw passthrough when disabled).
If you were reading Composio-managed access or refresh tokens from these responses — typically because you use Composio for OAuth and then call the provider's APIs yourself — register your own OAuth application with the provider and create a custom auth config against those credentials. Tokens issued against an OAuth application you own belong to you and are returned in full (subject to mask_secret_keys_in_connected_account).
2. Auth-config credentials
GET /api/v3/auth_configs and GET /api/v3/auth_configs/{id} no longer return sensitive credentials in a recoverable form.
- Composio-managed auth configs — every credential field is redacted.
- Customer-owned auth configs — public OAuth identifiers (
client_id,consumer_key) still pass through so you can debug OAuth flows. Every other credential field is obfuscated.
If your code reads a secret — for example client_secret or developer_token — out of these responses, you will need to keep that value alongside the code that created the auth config (typically in your own secret manager at upload time).
Why this change
A single OAuth application backs every team on a Composio-managed default integration, and the tokens and client secrets bound to it are shared. If a provider throttles, restricts, or suspends that app in response to misuse of one of its credentials, the integration becomes unavailable for every team on the default at once. Redacting the values keeps them out of API responses; Composio still uses them server-side, so tool execution is unchanged.
For customer-owned auth configs, masking a freshly re-read client_secret or developer_token limits the blast radius of a compromised project API key without breaking your ability to identify which credential was uploaded.
Affected endpoints
Connected accounts:
GET /api/v3/connected_accounts/{id}GET /api/v3/connected_accountsPOST /api/v3/connected_accounts- Webhook payloads that include connection credentials
Auth configs:
If your integration relies on reading access_token, refresh_token, client_secret, or developer_token from Composio API responses, you will need to act. All other integrations continue to work as before.
Observability APIs: tool execution logs and usage metering
Two new v3.1 observability API surfaces are live.
Tool execution logs
Search, filter, and paginate individual tool execution events. Use this for debugging failures, inspecting request/response payloads, and tracing user activity.
POST /api/v3.1/logs/tool_execution— list with filters, time range, and cursor pagination.GET /api/v3.1/logs/tool_execution/{id}— full detail including request payload, response body, timings, and source metadata.
Authentication: project API key (x-api-key) or session cookie.
See the tool execution logs guide.
Usage metering
Aggregated counts of tool calls and sessions. Summary endpoints return totals; breakdown endpoints group results by tool, toolkit, user, session, or project.
POST /api/v3.1/org/usage/summaryandPOST /api/v3.1/org/usage/{entity_type}— org scope (x-org-api-keyor org JWT).POST /api/v3.1/project/usage/summaryandPOST /api/v3.1/project/usage/{entity_type}— project scope (x-api-keyor cookie).
Entity types: tool_calls, sessions. Time ranges are epoch milliseconds; max range 366 days.
See the usage metering guide.
Multi-Account Mode & Connection Aliases
This release adds two features for managing multiple accounts per toolkit.
Multi-account mode
Sessions now support a multiAccount config that lets users connect and use multiple accounts for the same toolkit (e.g., work and personal Gmail) within a single session.
const session = await composio.create('user_123', {
  toolkits: ['gmail'],
  multiAccount: {
    enable: true,
    maxAccountsPerToolkit: 3,
  },
});
By default, multi-account mode is disabled and each session uses one account per toolkit.
Connection aliases
Connected accounts can now have human-readable aliases (e.g., "work-gmail", "personal-github"). Aliases can be set during connection or updated after.
// Set alias during connection
await session.authorize('gmail', { alias: 'work-gmail' });

// Update alias on an existing account
await composio.connectedAccounts.update('ca_abc123', { alias: 'work-gmail' });
Aliases must be unique per user and toolkit within a project.
See the multi-account guide for full details.
Introducing API v3.1 - Latest Tool Versions by Default
We're rolling out API v3.1 endpoints that change how tool versions are resolved. The key difference: tool-related endpoints now default to the latest toolkit version instead of the legacy pinned version (00000000_00).
What Changed
In API v3 (/api/v3/tools/*), tool-related endpoints default the version parameter to 00000000_00 (the initial pinned version). This means callers must explicitly pass version: "latest" (or toolkit_versions: "latest" for GET /tools) to get the most recent tool definitions.
In API v3.1 (/api/v3.1/tools/*), the default is flipped: tool-related endpoints default to the latest toolkit version. If you're already passing version: "latest" in your requests, switching to v3.1 changes nothing for you. If you were relying on the 00000000_00 default, you'll now get the latest version unless you explicitly pin.
Affected tool endpoints (those with a version parameter):
| Endpoint | Version Parameter | v3 Default | v3.1 Default |
|---|---|---|---|
GET /tools | toolkit_versions (query) | 00000000_00 | latest |
GET /tools/{tool_slug} | version (query) | 00000000_00 | latest |
POST /tools/execute/{tool_slug} | version (body) | 00000000_00 | latest |
POST /tools/execute/{tool_slug}/input | version (body) | 00000000_00 | latest |
POST /tools/scopes/required | version (body) | 00000000_00 | latest |
Triggers Are Unchanged
Trigger endpoints already default the version parameter to latest in both v3 and v3.1, so there is no behavior change for triggers. If you're using triggers, switching to v3.1 requires no changes.
All Other Endpoints Are Unchanged
Every non-tool endpoint (/auth_configs, /connected_accounts, /triggers, /toolkits, etc.) behaves identically between v3 and v3.1. They are served at both /api/v3/ and /api/v3.1/ paths with the same request and response contracts.
Migration Guide
If you're using the Composio SDK: No action needed. The SDK will adopt v3.1 endpoints in an upcoming release.
If you're calling the API directly:
- Replace
/api/v3/with/api/v3.1/in your tool endpoint URLs - If you depend on a specific pinned version, pass it explicitly —
version=00000000_00for most endpoints, ortoolkit_versions=00000000_00forGET /tools(see table above) - If you were already passing
version: "latest"(ortoolkit_versions: "latest"), you can drop the parameter entirely on v3.1
Before (v3):
curl "https://backend.composio.dev/api/v3/tools/GMAIL_SEND_EMAIL?version=latest" \
  -H "x-api-key: YOUR_KEY"
After (v3.1):
curl "https://backend.composio.dev/api/v3.1/tools/GMAIL_SEND_EMAIL" \
-H "x-api-key: YOUR_KEY"Bearer Token Connections & Credential Patching
Two features for teams managing their own authentication credentials.
Bearer Token for OAuth Toolkits
All OAuth2 toolkits (Gmail, GitHub, Slack, Google Docs, and more) now support BEARER_TOKEN as an auth scheme. Import your own access tokens directly without setting up an OAuth app.
BEARER_TOKEN is injected as an alternative scheme alongside OAuth2, so existing OAuth connections are unaffected.
How to use
- Create a custom auth config with
authScheme: "BEARER_TOKEN"for the toolkit - Create a connected account with your access token
- Pass the auth config or connection ID to
composio.create()for use with Tool Router
Creating bearer token auth configs is currently available only via API and SDK — not yet supported in the dashboard UI.
See the importing connections guide for full examples.
Credential Patching
New PATCH /api/v3/connected_accounts/{nanoid} endpoint and SDK method — update credentials and alias on existing connections without recreating them.
await composio.connectedAccounts.update('ca_abc123', {
  connection: {
    state: {
      authScheme: 'BEARER_TOKEN',
      val: { token: 'rotated-access-token' },
    },
  },
});- Keep access tokens updated — call PATCH whenever you refresh the token on your end (e.g., after an OAuth refresh flow)
- Partial updates — omitted fields are preserved, fields set to
nullare removed - Supported schemes — BEARER_TOKEN, API_KEY, BASIC, BASIC_WITH_JWT, GOOGLE_SERVICE_ACCOUNT, SERVICE_ACCOUNT
Tool consolidation and improved enum naming
We've completed a major effort to make Composio tools more agent-friendly. This release consolidates overlapping tools, deprecates redundant ones, and renames enum slugs to be cleaner and more intuitive for AI agents.
What's changing?
1. Consolidated overlapping tools
Many toolkits had multiple tools that performed similar functions — sometimes originating from different API versions or slightly different wrappers around the same endpoint. We've unified these into single, well-defined tools. The consolidated tools retain full functionality while reducing noise for agents selecting tools.
This affects 30+ toolkits. Tools that didn't add meaningful value to agent workflows have been removed, and their functionality is covered by the remaining tools.
2. Deprecated high-usage duplicates
For tools that had significant active usage, we've soft-deprecated them rather than removing them outright. These tools still work but will return a deprecation notice pointing to the recommended replacement. We encourage migrating to the replacement tools listed below.
3. Renamed enum slugs for agent clarity
We've renamed 1,445 tool enum slugs across 37 toolkits to be shorter, more consistent, and easier for agents to understand. The old names often contained unnecessary filler words (A, AN, THE, FOR_THE_AUTHENTICATED_USER) or verbose patterns that made it harder for agents to match the right tool. The new names follow a consistent APP_VERB_NOUN pattern.
No action required
If you are using latest toolkit versions or fetching tools dynamically, these changes will not break your integration. The SDK automatically resolves the correct tool names.
If you are pinning tool enums by name in your code, check the tables below for any renames or deprecations that affect you.
Deprecated tools
These tools still work but now point to a recommended replacement. Migrate when convenient.
Consolidated (removed) tools
These tools have been removed because their functionality is fully covered by other existing tools. If you were using any of these, switch to the canonical tool for that operation.
Renamed enum slugs
We've renamed 1,445 tool enum slugs across 37 toolkits to be more concise and agent-friendly. Old slugs contained verbose patterns like DELETE_A_GIST, GET_A_CODESPACE_FOR_THE_AUTHENTICATED_USER, or ADD_MEMBERS_FOR_PROJECT. New slugs follow a cleaner APP_VERB_NOUN convention: DELETE_GIST, GET_CODESPACE, ADD_MEMBERS_TO_PROJECT.
Migration
If you are using latest toolkit versions or fetching tools dynamically, no action is required.
If you reference tool enums by name in your code:
- Deprecated tools — update to the replacement listed above at your convenience. The old enum still works but will show a deprecation notice.
- Removed tools — switch to the canonical tool for that operation. The removed tool's functionality is fully covered.
- Renamed enums — update any hardcoded enum strings to the new names.
mcp.composio.dev Deprecated Endpoint Removed
We've permanently removed the deprecated mcp.composio.dev endpoint that was deprecated in November 2025.
This endpoint was part of our early MCP integration experiments and the latest MCP offering from Composio is Composio For You (access 1000+ apps through one MCP).
What Changed
- All traffic to
mcp.composio.devweb page now redirects to composio.dev/toolkits - The underlying service has been fully decommissioned
- No action needed if you're using our current MCP
Migrating?
If you were still using the old endpoint, head to https://dashboard.composio.dev/~/org/connect to get started with the new MCP.
Questions? Reach out to support@composio.dev
Custom Tools and Toolkits (Experimental)
You can now create custom tools and toolkits that run locally alongside remote Composio tools within a session.
SDK Version
| Package | Version |
|---|---|
| @composio/core | v0.6.6 |
| composio | v0.11.4 |
What's New
Custom tools support three patterns — standalone tools for internal logic, extension tools that wrap Composio toolkit APIs with business logic, and custom toolkits that group related tools. TypeScript uses builder functions with Zod schemas; Python uses decorators with Pydantic annotations.
// Standalone tool — internal data, no Composio auth needed
const getUserProfile = experimental_createTool("GET_USER_PROFILE", {
  name: "Get user profile",
  description: "Retrieve the current user's profile from the internal directory",
  inputParams: z.object({}),
  execute: async (_input, ctx) => {
    // ctx.userId identifies which user's session is running
    const profiles: Record<string, { name: string; tier: string }> = {
      "user_1": { name: "Alice Johnson", tier: "enterprise" },
    };
    return profiles[ctx.userId] ?? {};
  },
});

// Extension tool — wraps Gmail with preset business logic
// Inherits auth from the session via extendsToolkit
const sendPromoEmail = experimental_createTool("SEND_PROMO_EMAIL", {
  name: "Send promo email",
  description: "Send the standard promotional email to a recipient",
  extendsToolkit: "gmail",
  inputParams: z.object({ to: z.string().describe("Recipient email") }),
  execute: async (input, ctx) => {
    const raw = btoa(`To: ${input.to}\r\nSubject: Try MyApp Pro\r\n\r\nFree for 14 days.`);
    const res = await ctx.proxyExecute({
      toolkit: "gmail",
      endpoint: "https://gmail.googleapis.com/gmail/v1/users/me/messages/send",
      method: "POST",
      body: { raw },
    });
    return { status: res.status, to: input.to };
  },
});

// Custom toolkit — groups related tools under a namespace
const userManagement = experimental_createToolkit("USER_MANAGEMENT", {
  name: "User scoping",
  description: "Manage user roles and permissions",
  tools: [
    experimental_createTool("ASSIGN_ROLE", {
      name: "Assign role",
      description: "Assign a role to a user in the internal system",
      inputParams: z.object({
        user_id: z.string().describe("Target user ID"),
        role: z.enum(["admin", "editor", "viewer"]).describe("Role to assign"),
      }),
      execute: async ({ user_id, role }) => ({ user_id, role, assigned: true }),
    }),
  ],
});

// Bind everything to a session
const composio = new Composio({ apiKey: "your_api_key" });
const session = await composio.create("user_1", {
  toolkits: ["gmail"],
  experimental: {
    customTools: [getUserProfile, sendPromoEmail],
    customToolkits: [userManagement],
  },
});

const tools = await session.tools(); // Includes both remote and custom tools
SessionContext
Every custom tool's execute receives (input, ctx):
- TypeScript —
ctx.userId,ctx.proxyExecute(params),ctx.execute(toolSlug, args) - Python —
ctx.user_id,ctx.proxy_execute(...),ctx.execute(tool_slug, arguments)
Limitations
- Native tools only — custom tools work with
session.tools(). MCP support is coming soon. - Experimental API — the custom tool APIs and session
experimentaloption may change. - SDK-specific DX is intentional — TypeScript uses builder helpers and Zod. Python uses decorators, docstrings, and Pydantic annotations.
CLI Improvements: Login, Link, and Whoami
This release improves the Composio CLI with a better login flow, a non-blocking link option, and improved security for the whoami command.
CLI Version
| Package | Version |
|---|---|
| @composio/cli | v0.2.2 |
What's New
Interactive Org/Project Picker After Login
composio login now prompts you to select your default organization and project after the browser OAuth flow completes.
- Default behavior: After login, you see an interactive picker to choose your org and project. If you have only one org and one project, they are auto-selected.
- With
-y: Skip the picker and use the session defaults (e.g. for CI or scripts).
composio login           # Login, then pick org/project
composio login -y        # Login, use session defaults (no picker)
composio login --no-browser  # Print URL, don't open browser
Non-Interactive Link with --no-wait
composio link now supports a --no-wait flag for non-blocking authorization flows.
- Default: Opens the browser and waits until the connected account is ACTIVE.
- With
--no-wait: Prints link info and JSON to stdout (JQ-parseable) and exits immediately. Useful for scripts and CI.
composio link github              # Opens browser, waits for completion
composio link github --no-wait    # Prints redirect URL and JSON, exits
Whoami No Longer Exposes API Keys
The composio whoami command no longer displays API keys in the output. This improves security and reduces the risk of accidental exposure in logs or screenshots.
- API key is removed from both display and JSON output.
- Hints for
composio manage orgs switchandcomposio initare shown instead.
Breaking Changes
Removed Flags from Login and Init
The following flags have been removed from composio login and composio init:
--api-key--org-id--project-id
Breaking Change
If you previously used composio login --api-key uak_xxx --org-id X --project-id Y for non-interactive login (e.g. in CI), you must use the browser-based flow instead. Use composio login -y to skip the org/project picker and accept session defaults.
For composio init, the --org-id and --project-id flags are removed. Use composio init interactively, or run composio login first and then composio init.
Before:
composio login --api-key uak_xxx --org-id org_123 --project-id proj_456
composio init --org-id org_123 --project-id proj_456
After:
composio login -y        # Login with session defaults (no picker)
composio init            # Interactive project selection
Improvements
- Login JSON output: When using the org/project picker, the JSON output now reflects the final selection (not the initial session state).
- Picker error handling: If the org/project picker fails (e.g. API error), the CLI shows a warning, emits JSON with session data, and displays hints so you are not left without guidance.
- Modularized org/project selection: The selection logic is shared between
composio loginandcomposio manage orgs switch.
Polling Intervals: Transition Period for Existing Customers
We're allowing a transition period before enforcing the new polling interval limits.
Timeline
- Until May 1, 2026 — Existing customers continue to get 1-minute polling on all their triggers, including newly created ones.
- From May 1, 2026 — All triggers move to a 15-minute default polling interval. App-specific overrides will be available for apps with favorable rate limits.
If any of your triggers were affected by the recent changes, we've restored them to their original intervals.
Why 15 Minutes?
Composio-managed OAuth apps share rate limits across all users. At scale, 1-minute polling causes rate limiting and service degradation. The 15-minute minimum ensures reliability for everyone.
How to Keep 1-Minute Polling
Set up your own OAuth app. With custom auth:
- Intervals as low as 1 minute
- Your own rate limits
- No platform limits, ever
OAuth approval from Google, Microsoft, etc. takes days to weeks. Start now.
Polling Trigger Interval Changes
Update (March 13, 2026): Existing customers have a transition period until May 1, 2026. See updated changelog.
We're updating polling trigger intervals to improve platform reliability and avoid rate limiting. This change affects how frequently polling triggers execute.
What's Changing?
Default Polling Interval
The default polling interval for triggers is increasing from 1 minute to 15 minutes.
If you don't specify an interval in your trigger configuration, your triggers will now poll every 15 minutes instead of every 1 minute.
Minimum Polling Interval
A new minimum polling interval of 15 minutes is being introduced. Triggers configured with intervals shorter than 15 minutes will be automatically clamped to 15 minutes.
# Before: this would poll every 5 minutes
composio.triggers.enable(
    trigger_name="GMAIL_NEW_GMAIL_MESSAGE",
    connected_account_id="ca_xxx",
    config={"interval": 5}
)

# Now: interval is silently clamped to 15 minutes
composio.triggers.enable(
    trigger_name="GMAIL_NEW_GMAIL_MESSAGE",
    connected_account_id="ca_xxx",
    config={"interval": 5}  # Effective interval: 15 minutes
)
Current Behavior (Transition Period)
During the transition period, intervals below the minimum are silently clamped — your triggers will continue to work without errors, but they will run at the minimum interval instead of your requested interval.
Enforcement (April 15, 2026)
Starting April 15, 2026, requesting an interval below the minimum will return an API error instead of silently clamping. Update your trigger configurations to use an interval of 15 minutes or higher before this date.
# This will return an error after April 15, 2026
composio.triggers.enable(
    trigger_name="GMAIL_NEW_GMAIL_MESSAGE",
    connected_account_id="ca_xxx",
    config={"interval": 5}  # Error: interval must be >= 15 minutes
)
App-Level Interval Overrides
We will also be introducing app-specific default polling intervals. Each app will have its own default interval based on the rate limits that app allows and whether the rate limit is per-user or per-app. These app-level defaults may be lower or higher than 15 minutes depending on the app. When you don't specify an interval, the app-level default will be used instead of the global 15-minute default.
Need Intervals Below 15 Minutes?
If you require polling intervals shorter than 15 minutes, you should use your own OAuth app (custom auth). With custom auth, the 15-minute minimum does not apply — you can set polling intervals as low as 1 minute.
What You Need to Do
- Review your trigger configurations — check if any triggers use intervals shorter than 15 minutes
- Update intervals to 15 minutes or higher before April 15, 2026
- If you need near-real-time events, consider using webhook triggers instead of polling triggers, or use custom auth for intervals as low as 1 minute
Rollout Timeline
- March 11, 2026: Silent clamping enabled — intervals below 15 minutes are automatically raised to 15 minutes
- April 15, 2026: API enforcement — intervals below 15 minutes will return an error
- April 15, 2026: Dashboard enforcement — the UI will prevent setting intervals below 15 minutes
Existing triggers with intervals below 15 minutes will continue to function during the transition period, but at the clamped 15-minute interval. Update your configurations before April 15 to avoid errors.
MCP API Key Authentication Enabled by Default for New Orgs
As announced in our Optional API Key Enforcement for MCP Servers entry, MCP API key enforcement is now enabled by default for all newly created organizations.
What's Changed
From March 5, 2026, all projects in newly created organizations will have require_mcp_api_key set to true by default. Any MCP server request without a valid x-api-key header will be rejected with 401 Unauthorized.
| Setting | Previous Default | New Default (orgs created March 5+) |
|---|---|---|
require_mcp_api_key | false | true |
For New Organizations
- You can opt out by setting
require_mcp_api_key: falsein your project configuration
For Existing Organizations
Nothing changes for existing organizations. If your organization was created before March 5, 2026:
- Your current
require_mcp_api_keysetting remains unchanged - You can opt in at any time through your project settings or via the API
Opting Out (New Organizations)
If you need to disable API key enforcement, set require_mcp_api_key: false during project creation or update it afterward:
curl -X PATCH https://backend.composio.dev/api/v3/org/project/config \
  -H "Content-Type: application/json" \
  -H "x-api-key: YOUR_API_KEY" \
  -d '{"require_mcp_api_key": false}'
We strongly recommend keeping MCP API key enforcement enabled to prevent unauthorized access to your MCP servers. See the original announcement for setup details and usage examples.
230+ Deprecated Tools Now Flagged Across 70+ Apps
Toolkit version: 20260225_00 for all affected toolkits
Tools with deprecated upstream API endpoints are now properly flagged with deprecated = True. This covers ~230 tools across 70+ apps — identified by cross-referencing official API documentation.
All Deprecated Tools
Click to expand full list by app (230+ tools)
Accredible Certificates
ACCREDIBLE_CERTIFICATES_LIST_CREDENTIALS, ACCREDIBLE_CERTIFICATES_LIST_GROUPS, ACCREDIBLE_CERTIFICATES_SEARCH_CREDENTIALS
Affinda
AFFINDA_CREATE_DATA_POINT, AFFINDA_CREATE_DATA_POINT_CHOICE, AFFINDA_CREATE_MAPPING, AFFINDA_DELETE_DATA_POINT, AFFINDA_DELETE_EXTRACTOR, AFFINDA_DELETE_MAPPING, AFFINDA_GET_COLLECTION_FIELDS, AFFINDA_GET_COLLECTION_USAGE, AFFINDA_GET_DATA_POINT, AFFINDA_GET_DATA_POINT_CHOICE, AFFINDA_LIST_DATA_POINT_CHOICES, AFFINDA_REPLACE_DATA_POINT_CHOICES, AFFINDA_UPDATE_DATA_POINT, AFFINDA_UPDATE_DATA_POINT_CHOICE
Algolia
ALGOLIA_COMPUTE_REALTIME_USER, ALGOLIA_DISABLE_TASK_V1, ALGOLIA_ENABLE_TASK_V1, ALGOLIA_GET_TASK_V1, ALGOLIA_RUN_TASK_V1, ALGOLIA_SEARCH_TASKS_V1
API Ninjas
API_NINJAS_GET_CARS
Apify
APIFY_ACT_BUILD_ABORT_POST, APIFY_ACT_RUN_ABORT_POST, APIFY_ACT_RUN_GET, APIFY_ACT_RUN_RESURRECT_POST, APIFY_RESURRECT_RUN
Ashby
ASHBY_ARCHIVE_INTERVIEWER_POOL
BART
BART_GET_AVAILABLE_SCHEDULES, BART_GET_SPECIAL_SCHEDULES
Bitbucket
BITBUCKET_SEARCH_TEAM_CODE
Blackboard
BLACKBOARD_CREATE_COLUMN_GROUP_ATTEMPT, BLACKBOARD_UPDATE_COLUMN_ATTEMPT
Bolna
BOLNA_GET_AGENT_V1, BOLNA_PATCH_AGENT_V1
Box
BOX_GET_RETENTION_ON_FILE, BOX_LIST_FILE_VERSION_LEGAL_HOLDS, BOX_LIST_FILE_VERSION_RETENTIONS
BunnyCDN
BUNNYCDN_CREATE_COINIFY_PAYMENT, BUNNYCDN_GET_COINIFY_BTC_EXCHANGE_RATE, BUNNYCDN_GET_PREPARE_PAYMENT_AUTHORIZATION
Cal
CAL_CREATE_OAUTH_CLIENT_USER, CAL_CREATE_OAUTH_CLIENT_WEBHOOK_CONFIGURATION, CAL_DELETE_OAUTH_CLIENT_USER, CAL_DELETE_OAUTH_CLIENT_WEBHOOK, CAL_DELETE_ORGANIZATION_ATTRIBUTE_OPTION, CAL_FORCE_REFRESH_USER_OAUTH_CLIENT, CAL_REFRESH_OAUTH_TOKEN_FOR_CLIENT_ID, CAL_RETRIEVE_OAUTH_CLIENT_WEBHOOK_BY_ID
Canvas
CANVAS_LIST_STUDENTS
Clockify
CLOCKIFY_GET_TEMPLATE_BY_ID_ON_WORKSPACE, CLOCKIFY_UPDATE_TEMPLATE
Cloudinary
CLOUDINARY_GENERATE_SPRITE
Composio
COMPOSIO_CHECK_ACTIVE_CONNECTION
Confluence
CONFLUENCE_SEARCH_CONTENT
Conveyor
CONVEYOR_GET_AUTHORIZATION_REQUESTS_QUEUE
Crowdin
CROWDIN_CREATE_USERS_AI_SETTINGS_CUSTOM_PLACEHOLDERS, CROWDIN_DELETE_USERS_AI_SETTINGS_CUSTOM_PLACEHOLDERS, CROWDIN_GET_USERS_AI_SETTINGS_CUSTOM_PLACEHOLDERS, CROWDIN_LIST_USERS_AI_SETTINGS_CUSTOM_PLACEHOLDERS, CROWDIN_UPDATE_TMS_SEGMENTS_RECORDS, CROWDIN_UPDATE_USERS_AI_SETTINGS_CUSTOM_PLACEHOLDERS
Customer.io
CUSTOMERIO_REPORT_PUSH_EVENTS
Databricks
DATABRICKS_CATALOG_ONLINE_TABLES_DELETE, DATABRICKS_DASHBOARDS_GENIE_EXECUTE_MESSAGE_QUERY, DATABRICKS_DASHBOARDS_GENIE_GET_MESSAGE_QUERY_RESULT_BY_ATTACHMENT, DATABRICKS_ML_FEATURE_STORE_DELETE_ONLINE_TABLE, DATABRICKS_ML_MATERIALIZED_FEATURES_DELETE_FEATURE_TAG, DATABRICKS_SERVING_SERVING_ENDPOINTS_PUT, DATABRICKS_SQL_ALERTS_LEGACY_CREATE, DATABRICKS_SQL_ALERTS_LEGACY_GET, DATABRICKS_SQL_ALERTS_LEGACY_LIST, DATABRICKS_SQL_ALERTS_LEGACY_UPDATE, DATABRICKS_SQL_DASHBOARDS_GET, DATABRICKS_SQL_DBSQL_PERMISSIONS_GET, DATABRICKS_SQL_DBSQL_PERMISSIONS_SET, DATABRICKS_SQL_QUERIES_LEGACY_DELETE, DATABRICKS_SQL_QUERIES_LEGACY_RESTORE, DATABRICKS_SQL_QUERIES_LEGACY_UPDATE, DATABRICKS_SQL_QUERY_VISUALIZATIONS_LEGACY_CREATE, DATABRICKS_SQL_QUERY_VISUALIZATIONS_LEGACY_DELETE, DATABRICKS_SQL_QUERY_VISUALIZATIONS_LEGACY_UPDATE
DataRobot
DATAROBOT_CREATE_PROJECTS_MODELS_SHAP_IMPACT, DATAROBOT_GET_TRACING, DATAROBOT_GET_TRACING_BY_ID, DATAROBOT_LIST_EVENT_LOGS_EVENTS, DATAROBOT_LIST_PROJECTS_MODELS_DATASET_ROC_CURVES, DATAROBOT_LIST_PROJECTS_SHAP_MATRICES
Dialpad
DIALPAD_DELETE_DEPARTMENT_RESOURCE
Discord Bot
DISCORDBOT_LIST_VOICE_REGIONS
DocuSign
DOCUSIGN_DEPRECATED_ENDPOINT_FOR_TAB_BLOB, DOCUSIGN_GET_TABS_BLOB_FOR_ENVELOPE, DOCUSIGN_SHARE_TEMPLATE_WITH_GROUP
Dropbox
DROPBOX_GET_SHARED_LINKS
Eagle Doc
EAGLE_DOC_RECEIPT_QUOTA_V1, EAGLE_DOC_RECEIPT_QUOTA_V2, EAGLE_DOC_RECEIPT_OCR_V1
ElevenReader
ELEVENREADER_GET_SIGNED_URL_DEPRECATED
eSputnik
ESPUTNIK_GENERATE_EVENT_V1, ESPUTNIK_GENERATE_PAST_EVENTS_V1
Facebook
FACEBOOK_ADD_PHOTOS_TO_ALBUM, FACEBOOK_SEARCH_PAGES
Gladia
GLADIA_DELETE_TRANSCRIPTION_DEPRECATED, GLADIA_GET_TRANSCRIPTION_AUDIO_FILE_DEPRECATED, GLADIA_INITIATE_TRANSCRIPTION_DEPRECATED
Gleap
GLEAP_CREATE_HELPCENTER_REDIRECT
Google Analytics
GOOGLE_ANALYTICS_GET_CONVERSION_EVENT
Google Drive
GOOGLEDRIVE_CREATE_TEAM_DRIVE, GOOGLEDRIVE_DELETE_TEAM_DRIVE, GOOGLEDRIVE_DELETE_TEAM_DRIVE_V2, GOOGLEDRIVE_GET_CHANGE_V2, GOOGLEDRIVE_GET_TEAM_DRIVE, GOOGLEDRIVE_GET_TEAM_DRIVE_V2, GOOGLEDRIVE_INSERT_TEAM_DRIVE, GOOGLEDRIVE_LIST_TEAM_DRIVES, GOOGLEDRIVE_LIST_TEAM_DRIVES_V2, GOOGLEDRIVE_UPDATE_TEAM_DRIVE, GOOGLEDRIVE_UPDATE_TEAM_DRIVE_V2
Google Photos
GOOGLEPHOTOS_LIST_SHARED_ALBUMS
Happy Scribe
HAPPY_SCRIBE_HS_RETRIEVE_TRANSLATION_TASK
HERE
HERE_GET_META_INFO_TILE
HubSpot
HUBSPOT_PURGE_SCHEMA_BY_OBJECT_TYPE
Kaleido
KALEIDO_GET_RELEASES
Lexoffice
LEXOFFICE_GET_DELIVERY_NOTE_DOCUMENT
Loops
LOOPS_SO_LIST_CUSTOM_FIELDS
Loyverse
LOYVERSE_DELETE_CATEGORY
Mailchimp
MAILCHIMP_GET_CONVERSATION, MAILCHIMP_LIST_CONVERSATIONS, MAILCHIMP_LIST_MESSAGES
Mem0
MEM0_LIST_ENTITIES_WITH_OPTIONAL_ORG_AND_PROJECT_FILTERS
Metabase
METABASE_DELETE_API_CARD_ID, METABASE_PUT_API_DASHBOARD_ID_CARDS, METABASE_UPDATE_DASHBOARD_CARDS
Mixmax
MIXMAX_CREATE_CONTACT_GROUP, MIXMAX_DELETE_CONTACT_GROUP, MIXMAX_GET_CONTACT_NOTES, MIXMAX_GET_CONTACT_GROUP, MIXMAX_LIST_CONTACTS, MIXMAX_UPDATE_CONTACT_GROUP
monday.com
MONDAY_ADD_SUBSCRIBERS_TO_BOARD
Neon
NEON_DELETE_AUTH_DOMAIN_FROM_PROJECT, NEON_LIST_AUTH_OAUTH_PROVIDERS, NEON_GET_AUTH_EMAIL_SERVER, NEON_UPDATE_AUTH_OAUTH_PROVIDERS
New Relic
NEW_RELIC_DELETE_ALERTS_NOTIFICATION_CHANNEL
PagerDuty
PAGERDUTY_DELETE_RESPONSE_PLAY, PAGERDUTY_DELETE_RULE_FROM_RULESET_BY_ID, PAGERDUTY_GET_OAUTH_DELEGATIONS_REVOCATION_REQUESTS_STATUS, PAGERDUTY_GET_RESPONSE_PLAYS, PAGERDUTY_RETRIEVE_RESPONSE_PLAY_BY_ID
PostHog
POSTHOG_LIST_AND_FILTER_PROJECT_EVENTS, POSTHOG_RETRIEVE_PERSONS_FUNNEL_CORRELATION_DATA
Postman
POSTMAN_CREATE_A_COLLECTION_FROM_A_SCHEMA, POSTMAN_GET_ALL_API_RELEASES, POSTMAN_MERGE_A_FORK, POSTMAN_GET_ALL_TEST_RELATIONS, POSTMAN_GET_DOCUMENTATION_RELATIONS, POSTMAN_GET_ENVIRONMENT_RELATIONS, POSTMAN_GET_CONTRACT_TEST_RELATIONS, POSTMAN_GET_INTEGRATION_TEST_RELATIONS, POSTMAN_GET_TEST_SUITE_RELATIONS
Recruitee
RECRUITEE_LIST_CAREERS_LIST_TIME_FORMAT
ReferralRock
REFERRALROCK_POST_MEMBERACCESS, REFERRALROCK_POST_REFERRALS_STATUS
SafetyCulture
SAFETYCULTURE_GET_TASKS_INCIDENTS
Salesforce
SALESFORCE_GET_UI_API_MRU_LIST_RECORDS_ACCOUNT, SALESFORCE_GET_UI_API_MRU_LIST_INFO_ACCOUNT
Salesforce Service Cloud
SALESFORCE_SERVICE_CLOUD_AGENT_SENSITIVE_DATA_RULE_TRIGGERED, SALESFORCE_SERVICE_CLOUD_END_CHAT_SESSION
ScrapingAnt
SCRAPINGANT_GET_V1_USAGE, SCRAPINGANT_SCRAPE_WEBPAGE_V1_POST
SendGrid
SENDGRID_ADD_A_SINGLE_RECIPIENT_TO_A_LIST, SENDGRID_DELETE_A_RECIPIENT, SENDGRID_DELETE_A_SINGLE_RECIPIENT_FROM_A_SINGLE_LIST, SENDGRID_DELETE_SEGMENT, SENDGRID_RETRIEVE_A_SINGLE_RECIPIENT, SENDGRID_SEND_A_TEST_CAMPAIGN
Sentry
SENTRY_GET_ACTIVATION_OF_ALERT_RULE_FOR_ORGANIZATION, SENTRY_SUBMIT_PROJECT_USER_FEEDBACK, SENTRY_SUBMIT_USER_FEEDBACK
Seqera
SEQERA_CREATE_WAVE_CONTAINER_TOKEN
Shopify
SHOPIFY_ACTIVATE_ONE_TIME_CHARGE, SHOPIFY_COUNT_SCRIPTTAG, SHOPIFY_CREATE_PRODUCT, SHOPIFY_CREATE_COUNTRIES, SHOPIFY_CREATE_ORDER_RISK, SHOPIFY_DEL_ORDER_RISK, SHOPIFY_DELETE_COUNTRIES_PARAM_COUNTRY_ID, SHOPIFY_DELETE_SCRIPT_TAG, SHOPIFY_GET_COUNTRIES_COUNT, SHOPIFY_GET_ORDER_RISKS, SHOPIFY_GET_PRICE_RULE, SHOPIFY_LIST_ABANDONED_CHECKOUTS, SHOPIFY_RECEIVE_A_LIST_OF_ALL_COUNTRIES, SHOPIFY_REMOVE_AN_EXISTING_COUNTRY, SHOPIFY_RETRIEVES_A_LIST_OF_ABANDONED_CHECKOUTS, SHOPIFY_RETRIEVES_A_SINGLE_ORDER_RISK_BY_ITS_ID, SHOPIFY_UPDATE_COUNTRIES_PARAM_COUNTRY_ID, SHOPIFY_UPDATE_COUNTRY, SHOPIFY_UPDATE_EVENT_BRIDGE_WEBHOOK_SUBSCRIPTION, SHOPIFY_UPDATE_ORDER_RISK, SHOPIFY_UPDATES_AN_EXISTING_PROVINCE_FOR_A_COUNTRY
Shortcut
SHORTCUT_CREATE_MILESTONE, SHORTCUT_DELETE_MILESTONE, SHORTCUT_GET_MILESTONE, SHORTCUT_LIST_MILESTONE_EPICS, SHORTCUT_LIST_MILESTONES, SHORTCUT_UPDATE_MILESTONE
Simplesat
SIMPLESAT_CREATE_OR_UPDATE_CUSTOMER_V0, SIMPLESAT_LIST_ANSWERS
Slack
SLACK_MARK_REMINDER_AS_COMPLETE, SLACK_USERS_SET_ACTIVE, SLACK_RTM_START
SoundCloud
SOUNDCLOUD_FETCH_USER_FAVORITED_TRACKS, SOUNDCLOUD_GET_FOLLOWER_USER_DETAILS
Spotify
SPOTIFY_GET_AVAILABLE_GENRE_SEEDS, SPOTIFY_GET_CATEGORY_S_PLAYLISTS, SPOTIFY_GET_SEVERAL_TRACKS_AUDIO_FEATURES, SPOTIFY_GET_TRACK_S_AUDIO_FEATURES
Stripe
STRIPE_GET_CUSTOMERS_CUSTOMER_SOURCES_ID, STRIPE_GET_SOURCES_SOURCE, STRIPE_POST_CHARGES, STRIPE_POST_SOURCES_SOURCE
Supabase
SUPABASE_GET_PERFORMANCE_ADVISORS, SUPABASE_GET_DATABASE_METADATA, SUPABASE_GET_LEGACY_SIGNING_KEY, SUPABASE_GET_PROJECT_LEGACY_API_KEYS, SUPABASE_GET_SECURITY_ADVISORS
Trello
TRELLO_UPDATE_BOARDS_MY_PREFS_SHOW_LIST_GUIDE_BY_ID_BOARD, TRELLO_UPDATE_SESSIONS_STATUS_BY_ID_SESSION
Turbot Pipes
TURBOT_PIPES_CREATE_USER_CONNECTION_DEPRECATED, TURBOT_PIPES_DELETE_USER_CONNECTION_DEPRECATED, TURBOT_PIPES_GET_USER_CONNECTION_DEPRECATED, TURBOT_PIPES_LIST_USER_CONNECTION_DEPRECATED, TURBOT_PIPES_TEST_USER_CONNECTION_DEPRECATED, TURBOT_PIPES_UPDATE_ORG_CONNECTION_DEPRECATED, TURBOT_PIPES_UPDATE_USER_CONNECTION_DEPRECATED
Vercel
VERCEL_GET_ALL_LOG_DRAINS
Wix
WIX_FIND_EVENT, WIX_QUERY_EVENTS_EVENTS, WIX_GET_SENDER_DETAILS, WIX_LIST_CATALOGS, WIX_LIST_SESSIONS
YouTube
YOUTUBE_MARK_COMMENT_AS_SPAM
Zoom
ZOOM_LIST_IQ_SETTINGS_INDICATORS
Zulip
ZULIP_MARK_ALL_AS_READ, ZULIP_REMOVE_FCM_TOKEN, ZULIP_SEND_TEST_NOTIFICATION
Why This Matters
- Cleaner tool selection: Agents no longer see deprecated tools when browsing available tools, reducing confusion and failed tool executions
- No breaking changes: Deprecated tools are flagged, not removed — they'll still work as long as the upstream API endpoint remains available
26 Toolkits Deprecated
26 toolkits have been deprecated — 7 for dead/defunct services and 19 that were duplicates, rebrands, or naming variants of existing toolkits.
Dead Services (7)
These services are no longer operational:
cloudpress, bench, leadoku, induced_ai, docnify, logoraisr, ncscale
Duplicates, Rebrands, and Naming Variants (19)
These toolkits were redundant with existing ones and have been deprecated in favor of the canonical version:
| Deprecated Toolkit | Use Instead | Reason |
|---|---|---|
doppler_secretops | doppler | Duplicate |
rev_ai | rev | Duplicate |
metaphor | exa | Rebranded |
reply | reply_io | Duplicate |
foursquare_v1 | foursquare | Legacy version |
foursquare_v2 | foursquare | Legacy version |
polygon_io | polygon | Subset |
customer_io | customerio | Naming variant |
parsio_io | parsio | Naming variant |
onbee_app | onbee | Naming variant |
fixer_io | fixer | Naming variant |
ip2location_io | ip2location | Naming variant |
cloudflare_api_key | cloudflare | Different auth only |
onesignal_user_auth | onesignal_rest_api | Identical functionality |
firecrawl2 | firecrawl | Version variant |
openweather_api | weathermap | Same API |
scheduleonce | oncehub | Rebranded |
elevenreader | elevenlabs | Duplicate |
sendbird_ai_chabot | sendbird | Subset |
Why This Matters
- Less confusion: Developers won't accidentally pick a deprecated variant when a canonical toolkit exists
- Cleaner discovery: Toolkit listings now surface only the actively maintained version of each service
Slackbot Toolkit: Bot-Compatible Actions Only
Toolkit version: 20260223_00
The Slackbot toolkit inherits actions from the Slack toolkit. Previously, it included all 155 actions — but many of these were admin-only endpoints (admin.*) that require user tokens and don't work with bot tokens.
We've filtered the action list down to 89 bot-compatible actions — only actions whose Slack API endpoints are callable with a bot token.
What Changed
| Category | Count |
|---|---|
| Bot-compatible actions (included) | 89 |
| Admin/non-bot actions (removed) | 62 |
| Triggers (unchanged) | 9 |
Why This Matters
- Actions that work: Every action in the Slackbot toolkit now works with standard bot tokens
- Clearer scope: No more confusion about which actions require elevated permissions
- All triggers kept: Event-based triggers work with bot tokens and remain available
Removed Actions
The following action categories were removed because they require user tokens or admin permissions:
admin.*endpoints (workspace administration)audit.*endpoints (audit logs)- SCIM endpoints (user provisioning)
If you need admin-level Slack functionality, use the full Slack toolkit with appropriate user token authentication.
Webhook V3 Now Default for New Organizations
As announced in our Webhook Payload V3 lookahead, Webhook Payload V3 is now the default for all newly created organizations.
What's Changed?
Starting today, every new organization created on Composio will automatically use Webhook Payload V3 for all webhook and Pusher deliveries. This means new organizations benefit from the improved webhook structure out of the box, with no additional configuration needed.
For New Organizations
- Webhook payloads follow the Standard Webhooks specification
- Trigger data is cleanly separated from Composio metadata via the
metadataanddatafields - The
x-composio-webhook-version: V3header is included in all webhook deliveries
For Existing Organizations
Nothing changes for existing organizations. If your organization was created before today:
- You will continue to receive webhooks in your current format (V1 or V2)
- You can opt-in to V3 at any time through your project settings
V3 Payload Recap
{
  "id": "msg_a1b2c3d4-5e6f-7a8b-9c0d-1e2f3a4b5c6d",
  "timestamp": "2026-02-15T12:00:00.000Z",
  "type": "composio.trigger.message",
  "metadata": {
    "log_id": "log_TpxVOLXYnwXZ",
    "trigger_slug": "GMAIL_NEW_GMAIL_MESSAGE",
    "auth_config_id": "ac_aCYTppZ5RsRc",
    "connected_account_id": "ca_cATYssZ5RrSc",
    "trigger_id": "ti_JZFoTyYKbzhB",
    "user_id": "your-user-id"
  },
  "data": {
    // Clean trigger data without Composio metadata
  }
}
How to Switch to V3 (Existing Organizations)
- Go to your project settings in the Composio dashboard
- Navigate to the Webhooks section
- Select Webhook Payload Version: V3
- Update your webhook handlers using the migration guide
- Test thoroughly before enabling in production
We strongly recommend all organizations migrate to V3 for a better developer experience, standards compliance, and access to new features like connection expiry events.
Removal of Composio Managed Credentials for Twitter Toolkit
Composio managed credentials for the Twitter toolkit have been removed. Going forward, developers will need to provide their own Twitter API credentials to continue integrating Twitter into their applications.
What's Changing?
Previously, Composio provided managed credentials for the Twitter toolkit, allowing developers to use Twitter integrations without setting up their own Twitter API credentials. This managed credential support has now been removed.
Impact
If you were relying on Composio managed credentials for the Twitter toolkit, your Twitter integrations will no longer work until you configure your own credentials.
Migration
To continue using the Twitter toolkit, you will need to:
- Create a Twitter Developer account and obtain your own API credentials from the Twitter Developer Portal.
- Set up a custom auth configuration with your Twitter API credentials in Composio.
Action Required
If you are currently using Composio managed credentials for Twitter, you must bring your own Twitter API credentials to avoid disruption. Set up your own auth configuration before your existing connections expire.
Standardized Toolkit Categories
We've standardized the category taxonomy across all toolkits. Previously, categories were inconsistently applied with variations in naming and structure. Now, every toolkit is assigned categories from a well-defined set that can be extended as needed.
What Changed
All toolkits have been recategorized using a standardized set of categories:
AI & Automation: Artificial Intelligence, AI Agents, AI Assistants, AI Chatbots, AI Content Generation, AI Document Extraction, AI Meeting Assistants, AI Models, AI Safety Compliance Detection, AI Sales Tools, AI Web Scraping, Model Context Protocol
Business & Commerce: Business Intelligence, Analytics, Dashboards, Reviews, Commerce, Accounting, eCommerce, Fundraising, Payment Processing, Proposal & Invoice Management, Taxes
Communication: Communication, Call Tracking, Email, Fax, Notifications, Phone & SMS, Team Chat, Team Collaboration, Video Conferencing
Content & Files: Content & Files, Documents, File Management & Storage, Images & Design, Notes, Transcription, Video & Audio
Human Resources: Human Resources, Education, HR Talent & Recruitment
IT & Development: IT Operations, Databases, Developer Tools, Online Courses, Security & Identity Tools, Server Monitoring, Internet of Things
Lifestyle: Lifestyle & Entertainment, Fitness, Gaming, News & Lifestyle
Marketing: Marketing, Ads & Conversion, Drip Emails, Email Newsletters, Event Management, Marketing Automation, Social Media Accounts, Social Media Marketing, Transactional Email, URL Shortener, Webinars
Productivity: Productivity, Bookmark Managers, Calendar, Product Management, Project Management, Spreadsheets, Task Management, Time Tracking Software
Sales & Support: Sales & CRM, Contact Management, CRM, Forms & Surveys, Scheduling & Booking, Signatures, Support, Customer Appreciation, Customer Support
Web & Apps: Website & App Building, App Builder, Website Builders
Why This Matters
- Better discovery: Find relevant toolkits faster with consistent categorization
- Cleaner filtering: Filter toolkits by category in the dashboard and API with predictable values
- Extensible: New categories can be added as the toolkit ecosystem grows
API Impact
The categories field in toolkit responses now returns values from this standardized set. If you're filtering toolkits by category, update your queries to use the new category names.
Granola, monday.com, Context7, and Wix Toolkits
We've shipped four new toolkits in the first wave of external MCPs now available as native toolkits in Composio. Use them directly for tool calling or via Tool Router.
New Toolkits
- Granola: AI meeting notes that transcribe and summarize calls into structured notes.
- monday.com: Work management platform for projects, tasks, and team workflows.
- Context7: Up-to-date library documentation and code examples for LLMs.
- Wix: Build and manage projects with business solutions like eCommerce, Bookings, and Payments in a few prompts via AI tools (Cursor/Claude) through the Wix MCP server.
Webhook Subscriptions API & Connection Expiry Events
A new API for managing webhook configurations with event filtering, HMAC signature verification, and support for platform lifecycle events. This replaces the legacy project-level webhook settings with a more flexible, subscription-based model.
Summary
| Change | Type | Action Required |
|---|---|---|
| New Webhook Subscriptions API | New Feature | No |
composio.connected_account.expired event | New Feature | Opt-in |
| Legacy webhook endpoints | Deprecated | Migration recommended |
webhook_url, webhook_secret in Project | Deprecated | Use new API |
API Overview
See the Webhook Subscriptions API Reference for complete details.
Endpoints
| Method | Endpoint | Description |
|---|---|---|
POST | /api/v3/webhook_subscriptions | Create a subscription |
GET | /api/v3/webhook_subscriptions | List all subscriptions |
GET | /api/v3/webhook_subscriptions/{id} | Get subscription details |
PATCH | /api/v3/webhook_subscriptions/{id} | Update subscription |
DELETE | /api/v3/webhook_subscriptions/{id} | Delete subscription |
POST | /api/v3/webhook_subscriptions/{id}/rotate_secret | Rotate signing secret |
GET | /api/v3/webhook_subscriptions/event_types | List available event types |
Key Capabilities
- Event filtering: Subscribe only to events you need
- HMAC-SHA256 signatures: Every webhook includes a cryptographic signature for verification
- Secret rotation: Rotate signing secrets on demand
Creating a Subscription
curl -X POST "https://backend.composio.dev/api/v3/webhook_subscriptions" \
  -H "x-api-key: YOUR_API_KEY" \
  -H "Content-Type: application/json" \
  -d '{
    "webhook_url": "https://your-server.com/webhooks/composio",
    "enabled_events": ["composio.trigger.message"],
    "version": "V3"
  }'
Response:
{
  "id": "ws_your-subscription-id",
  "webhook_url": "https://your-server.com/webhooks/composio",
  "version": "V3",
  "enabled_events": ["composio.trigger.message"],
  "secret": "<your-webhook-secret>",
  "created_at": "2026-02-06T12:00:00.000Z",
  "updated_at": "2026-02-06T12:00:00.000Z"
}
The secret is only returned once at creation time or when rotated. Store it securely for signature verification.
Notes
- 1 subscription per project: Currently limited to one webhook subscription per project. This will be expanded in future releases.
- HTTPS required: Webhook URLs must use HTTPS in production environments.
New Event: composio.connected_account.expired
A new platform event that notifies you when an OAuth2 connected account's authentication expires and cannot be automatically refreshed.
This event is only available in V3 format. We strongly recommend using V3 for all new integrations to access the latest features and follow standard webhook practices.
Use Cases
- Prompt users to re-authenticate before workflows fail
- Track connection health across your user base
- Automate re-connection flows
- Build proactive notification systems
Subscribing to Connection Expiry Events
curl -X POST "https://backend.composio.dev/api/v3/webhook_subscriptions" \
  -H "x-api-key: YOUR_API_KEY" \
  -H "Content-Type: application/json" \
  -d '{
    "webhook_url": "https://your-server.com/webhooks/composio",
    "enabled_events": [
      "composio.trigger.message",
      "composio.connected_account.expired"
    ],
    "version": "V3"
  }'
Payload Structure
The composio.connected_account.expired event follows the V3 envelope format:
{
  "id": "evt_847cdfcd-d219-4f18-a6dd-91acd42ca94a",
  "timestamp": "2026-02-06T12:00:00.000Z",
  "type": "composio.connected_account.expired",
  "metadata": {
    "project_id": "pr_your-project-id",
    "org_id": "ok_your-org-id"
  },
  "data": {
    "toolkit": {
      "slug": "gmail"
    },
    "auth_config": {
      "id": "ac_your-auth-config-id",
      "auth_scheme": "OAUTH2",
      "is_composio_managed": true,
      "is_disabled": false
    },
    "id": "ca_your-connected-account-id",
    "status": "EXPIRED",
    "created_at": "2025-12-01T10:00:00.000Z",
    "updated_at": "2026-02-06T12:00:00.000Z",
    "status_reason": "OAuth refresh token expired",
    "is_disabled": false
  }
}
The data object matches the response from GET /api/v3/connected_accounts/{id}, making it easy to process with existing code and SDK types.
Verifying Webhook Signatures
All webhooks include an HMAC signature in the webhook-signature header. Use the SDK's built-in verification functions or see the Triggers documentation for implementation details.
Available Event Types
Query available events and their version compatibility:
curl "https://backend.composio.dev/api/v3/webhook_subscriptions/event_types" \
-H "x-api-key: YOUR_API_KEY"| Event Type | Description | Supported Versions |
|---|---|---|
composio.trigger.message | Trigger events from integrations | V1, V2, V3 |
composio.connected_account.expired | Connection authentication expired | V3 only |
Deprecations
Deprecated Endpoints
The following legacy endpoints are deprecated and will be removed in a future release:
| Deprecated Endpoint | Replacement |
|---|---|
GET /api/v3/org/project/webhook | GET /api/v3/webhook_subscriptions |
POST /api/v3/org/project/webhook/update | POST /api/v3/webhook_subscriptions |
DELETE /api/v3/org/project/webhook | DELETE /api/v3/webhook_subscriptions/{id} |
POST /api/v3/org/project/webhook/refresh | POST /api/v3/webhook_subscriptions/{id}/rotate_secret |
Deprecated Fields in Project Response
| Field | Status | Notes |
|---|---|---|
webhook_url | Deprecated | Use Webhook Subscriptions API |
webhook_secret | Deprecated | Use Webhook Subscriptions API |
event_webhook_url | Deprecated | Never implemented |
is_new_webhook | Deprecated | Use Webhook Subscriptions API |
Backward Compatibility
No immediate action required. Your existing webhook configurations will continue to work.
What We've Done For You
- Automatic migration: We've created a webhook subscription for all existing projects that had webhook URLs configured, with
composio.trigger.messageenabled by default - Same payload format: If you were using V1, V2, or V3 triggers, they continue with the same format
What Continues to Work
- Legacy webhook endpoints (deprecated but functional)
- Existing project webhook configurations
- All existing trigger payload formats (V1, V2, V3)
- Signature verification with your existing secret
Payload Version Comparison
| Version | Format | Recommendation |
|---|---|---|
| V1 | Legacy flat structure | For backward compatibility only |
| V2 | Nested with metadata | For existing integrations |
| V3 | Structured envelope with id, timestamp, type, metadata, data | Recommended for all new integrations |
75+ More Toolkits Get Typed Responses & Consistent Response Schema Wrapping
We've expanded typed response coverage to 75+ additional toolkits. In total, over 130 toolkits now return strongly typed response objects. Additionally, we've standardized response schema wrapping so that all action responses consistently nest their output under a top-level data field.
Breaking Change for latest Version
Two breaking changes ship in this release:
-
Newly typed toolkits — If your code depends on the old
response_datastructure for any of the 75+ newly typed toolkits listed below, you'll need to update your code to work with the new typed response schemas. -
Consistent response wrapping — Actions that previously had
dataat the root level of their response schema now wrap the entire response under adatafield. See the migration guide below.
Consistent Response Schema Wrapping
Previously, actions whose response schema already contained a data field at the root level would surface all fields (including data) alongside successful and error at the top level. Now, all action responses are uniformly wrapped: the full response object is nested inside a data field, with successful and error at the top level.
Affected: Toolkits with data in their response model (e.g., Pipedrive PIPEDRIVE_LIST_UPDATES_ABOUT_A_DEAL)
These actions had a data field in their original response schema. Previously, those fields were spread at the root level alongside successful and error. Now, they are nested under a top-level data field.
Before:
{
  "data": { "deal_id": 1, "field_key": "stage_id", "old_value": "1", "new_value": "2" },
  "successful": true,
  "error": null
}
After:
{
  "data": {
    "data": { "deal_id": 1, "field_key": "stage_id", "old_value": "1", "new_value": "2" }
  },
  "successful": true,
  "error": null
}
If your code accesses fields directly at the root level (e.g., result["data"]), update it to access them under result["data"]["data"] instead.
Not affected: Toolkits without data in their response model (e.g., GitHub GITHUB_GET_THE_LATEST_RELEASE)
These actions never had a data field in their original response schema, so their wrapping behavior is unchanged. The response fields are nested under data as before.
{
  "data": {
    "url": "https://api.github.com/repos/octocat/Hello-World/releases/1",
    "tag_name": "v1.0.0",
    "name": "v1.0.0",
    "draft": false,
    "prerelease": false,
    "author": { "login": "octocat", "id": 1 }
  },
  "successful": true,
  "error": null
}
No migration needed for these toolkits.
75+ Newly Typed Response Toolkits
All outputs for these toolkits now return strongly typed objects with clear field documentation instead of generic response_data blobs. Combined with the 60+ toolkits typed in the previous release, over 130 toolkits now have typed responses.
Limit Parameter Now Prevents Important Flag Auto-Apply
Version Information
TypeScript/JavaScript
- Package:
@composio/coreand all provider packages - Version:
0.6.3+ - PR: #2570
The important flag auto-apply logic has been updated to respect the limit parameter. When you provide a limit, the SDK no longer automatically applies important: true, ensuring you get the exact number of tools you requested.
What Changed
Previously, when querying tools by toolkit with both toolkits and limit parameters, the SDK would auto-apply important: true. This could result in returning fewer tools than the requested limit if the toolkit had limited important tools.
Before:
// Could return < 50 tools if only 10 important tools exist
const tools = await composio.tools.get('default', {
  toolkits: ['github'],
  limit: 50,
});
// Result: Only 10 tools (important ones only)
After:
// Returns exactly 50 tools (or all available if < 50)
const tools = await composio.tools.get('default', {
  toolkits: ['github'],
  limit: 50,
});
// Result: 50 tools (including non-important)
Auto-Apply Logic
The important flag is now auto-applied only when ALL of these conditions are met:
toolkitsis providedtoolsis NOT providedtagsis NOT providedsearchis NOT providedlimitis NOT provided ← NEWimportantis NOT explicitly set tofalse
Examples
Auto-Applies Important (No Limit)
const tools = await composio.tools.get('default', {
  toolkits: ['github'],
});
// Returns: ~10-20 important tools
Does NOT Auto-Apply (Limit Provided)
const tools = await composio.tools.get('default', {
  toolkits: ['github'],
  limit: 50,
});
// Returns: Exactly 50 tools (or all available)
Explicit Important Overrides
const tools = await composio.tools.get('default', {
  toolkits: ['github'],
  limit: 50,
  important: true,
});
// Returns: Up to 50 important tools
Prevents Auto-Apply (Tags Provided)
const tools = await composio.tools.get('default', {
  toolkits: ['github'],
  tags: ['important'],
});
// Returns: GitHub tools with 'important' tag (no auto-apply)
Prevents Auto-Apply (Search Provided)
const tools = await composio.tools.get('default', {
  toolkits: ['github'],
  search: 'repository',
});
// Returns: GitHub tools matching search (no auto-apply)
Why This Matters
When you provide a limit, you're explicitly requesting a specific number of tools. Auto-applying the important filter could prevent you from getting the requested number of tools. This change respects user intent and makes the SDK behavior more predictable.
Use cases:
- Pagination: Get exactly N tools per page
- Performance: Limit tool count for faster responses
- UI constraints: Display a specific number of tools in your interface
Backward Compatibility
This change is backward compatible with one caveat:
- No code changes needed for most users
- If you were relying on automatic
importantfiltering withlimit, you now need to explicitly passimportant: true
Migration (if needed):
// Before (relied on auto-apply even with limit)
const tools = await composio.tools.get('default', {
  toolkits: ['github'],
  limit: 20,
});

// After (explicit important flag)
const tools = await composio.tools.get('default', {
  toolkits: ['github'],
  limit: 20,
  important: true, // Explicitly set if you want important tools
});
Documentation
Full documentation with more examples is available in the Tools API Reference.
Expanded Typed Responses with GitHub, Mailchimp & Trello - Planning Further Expansion
We've expanded our typed response support to include three major toolkits—GitHub, Mailchimp, and Trello—while also adding more typed actions across previously updated toolkits. All outputs now return strongly typed objects with clear field documentation instead of generic response_data blobs, enabling better IDE support and more reliable agent interactions.
Breaking Change for latest Version
If you're using the latest version and your code depends on the old response_data structure for GitHub, Mailchimp, or Trello, you'll need to update your code to work with the new typed response schemas.
Why This Matters
- Enhanced type safety: GitHub, Mailchimp, and Trello now have fully typed responses
- Expanded action coverage: More actions in existing toolkits now return typed data
- Improved developer experience: Better autocomplete and field validation across all toolkits
- Agent-friendly schemas: Cleaner output shapes reduce parsing errors and improve AI tool usage
Coming Soon: 40+ More Toolkits
We're planning to expand typed response coverage to 40+ additional toolkits in upcoming releases.
Type-Safe get_tools() for Python SDK
The Python SDK's Composio class is now generic over the provider type. When you pass a provider to Composio(), the return type of tools.get() is automatically inferred based on that provider.
SDK Versions
| SDK | Version |
|---|---|
| Python | v0.11.1+ |
What Changed
Before: The return type of tools.get() was always untyped or required manual type annotations.
After: Type checkers (mypy, Pyright) automatically infer the correct tool type from the provider you pass.
Before (untyped):
from composio import Composio
from composio_anthropic import AnthropicProvider

composio = Composio(provider=AnthropicProvider())
tools = composio.tools.get(user_id="user_123", toolkits=["github"])
# tools: Unknown type - no inference
After (type-safe):
from composio import Composio
from composio_anthropic import AnthropicProvider

composio = Composio(provider=AnthropicProvider())
tools = composio.tools.get(user_id="user_123", toolkits=["github"])
# tools: list[ToolParam] - automatically inferred!
Automatic Type Inference
The Composio class now uses Python generics to provide type-safe return values:
from composio import Composio
from composio_openai import OpenAIProvider
from composio_anthropic import AnthropicProvider

# OpenAI provider -> list[ChatCompletionToolParam]
composio_openai = Composio(provider=OpenAIProvider())
openai_tools = composio_openai.tools.get(user_id="user", toolkits=["github"])

# Anthropic provider -> list[ToolParam]
composio_anthropic = Composio(provider=AnthropicProvider())
anthropic_tools = composio_anthropic.tools.get(user_id="user", toolkits=["github"])

# Default (no provider) -> list[ChatCompletionToolParam] (OpenAI)
composio_default = Composio()
default_tools = composio_default.tools.get(user_id="user", toolkits=["github"])
Custom Provider Support
Custom providers automatically get proper type inference without requiring any changes to the Composio SDK:
import typing as t
from typing import Sequence

from composio import Composio
from composio.client.types import Tool
from composio.core.provider import NonAgenticProvider


class MyCustomTool(t.TypedDict):
    """Your custom tool format."""
    name: str
    description: str
    parameters: dict


MyCustomToolCollection = t.List[MyCustomTool]


class MyCustomProvider(
    NonAgenticProvider[MyCustomTool, MyCustomToolCollection],
    name="my-custom"
):
    def wrap_tool(self, tool: Tool) -> MyCustomTool:
        return MyCustomTool(
            name=tool.slug,
            description=tool.description or "",
            parameters=tool.input_parameters or {},
        )

    def wrap_tools(self, tools: Sequence[Tool]) -> MyCustomToolCollection:
        return [self.wrap_tool(tool) for tool in tools]


# Type inference works automatically!
composio = Composio(provider=MyCustomProvider())
tools = composio.tools.get(user_id="user", toolkits=["github"])
# tools: list[MyCustomTool] - correctly inferred
Supported Providers
Type inference is supported for all built-in providers:
| Provider | Tool Type |
|---|---|
| OpenAI | ChatCompletionToolParam |
| OpenAI Responses | dict[str, Any] |
| Anthropic | ToolParam |
| Google (GenAI) | FunctionDeclaration |
| Gemini | FunctionDeclaration |
| Google ADK | Tool |
| LangChain | StructuredTool |
| LangGraph | StructuredTool |
| LlamaIndex | FunctionTool |
| CrewAI | Tool |
| AutoGen | FunctionTool |
| OpenAI Agents | FunctionTool |
| Claude Agent SDK | Tool |
Backward Compatibility
This change is fully backward compatible:
- Existing code continues to work without modifications
- Type inference is opt-in via static type checkers
- No runtime behavior changes
- No migration required
Simplified Schemas for Optional Fields
Tool schemas are now cleaner for optional fields by removing redundant anyOf: [{type}, {type: "null"}] constructs.
Background: How JSON Schema Handles Optional Fields
In JSON Schema, there are two distinct concepts:
| Concept | Meaning | How it's expressed |
|---|---|---|
| Optional | Field can be omitted entirely | Field is NOT in the required array |
| Nullable | Field accepts null as a value | anyOf: [{type}, {type: "null"}] |
Previously, our schemas used anyOf with null type for all optional fields—even when the field wasn't in required. This was redundant: if a field can be omitted, explicitly marking it as "accepts null" adds no value.
What Changed
For fields that are not in the required array, the schema processing now:
- Removes the redundant
{type: "null"}fromanyOfarrays - Removes
default: nullsince it's implied by being optional - Flattens single-type
anyOfto directtypedeclarations
Before vs After
For example, the page_token field in GOOGLECALENDAR_LIST_CALENDARS (which is optional/not required):
Previous (verbose):
{
  "page_token": {
    "anyOf": [
      { "type": "string" },
      { "type": "null" }
    ],
    "default": null,
    "description": "Token for the page of results to return...",
    "title": "Page Token"
  }
}
Now (simplified):
{
  "page_token": {
    "type": "string",
    "description": "Token for the page of results to return...",
    "title": "Page Token"
  }
}
What's Preserved
- Required nullable fields: Fields in the
requiredarray that accept null still useanyOfwith null type - Union types: Fields accepting multiple value types (e.g.,
string | number) retain their fullanyOfarray
Why This Matters
- Fewer tokens: Simpler schemas reduce token usage when tools are passed to LLMs
- Better compatibility: Some code generators and validators handle direct types better than
anyOfconstructs - Clearer semantics: Non-required fields don't need explicit null type—being optional already implies they can be omitted
SDK 0.6.0 Major Update: Cloudflare Workers Support and Breaking Changes
Version Information
TypeScript/JavaScript
- Package:
@composio/coreand all provider packages - Version:
0.6.0+
Python
- Package:
composioand all provider packages - Version:
0.11.0+
This major release focuses on Cloudflare Workers compatibility, platform-specific optimizations, and critical bug fixes. It includes breaking changes in both TypeScript and Python SDKs.
Breaking Changes: This release includes breaking changes that require code modifications:
TypeScript:
- Webhook verification: Now async + signature changed (must add
await+ new required params:id,timestamp) - Mastra provider updated to v1 API
Python:
- Webhook verification: Signature changed (new required parameters:
id,timestamp- still synchronous)
See the Migration Guide for detailed upgrade instructions.
Breaking Changes
1. Webhook Verification Breaking Changes
TypeScript PR: #2436 | Python PR: #2361
The webhook verification API has breaking changes in both SDKs to support multiple webhook versions (v1, v2, v3) and edge runtime compatibility.
TypeScript: Now Async + Signature Changed
The verifyWebhook() method has two breaking changes: it's now async AND requires additional parameters.
Before:
import { Composio } from '@composio/core';

const composio = new Composio();

// Old signature - synchronous, fewer parameters
const payload = composio.triggers.verifyWebhook({
  payload: req.body.toString(),
  signature: req.headers['x-composio-signature'] as string,
  secret: process.env.COMPOSIO_WEBHOOK_SECRET!,
});
// Returns: TriggerEvent
After:
import { Composio } from '@composio/core';

const composio = new Composio();

// New signature - async, requires id and timestamp
const result = await composio.triggers.verifyWebhook({
  id: req.headers['webhook-id'] as string, // NEW: required
  payload: req.body.toString(),
  secret: process.env.COMPOSIO_WEBHOOK_SECRET!,
  signature: req.headers['webhook-signature'] as string, // header name changed
  timestamp: req.headers['webhook-timestamp'] as string, // NEW: required
  tolerance: 300, // optional, default 300 seconds
});
// Returns: VerifyWebhookResult with version info
Key Changes:
- ⚠️ Now async - Must use
await - ⚠️ New required parameter:
id(fromwebhook-idheader) - ⚠️ New required parameter:
timestamp(fromwebhook-timestampheader) - ⚠️ Header name changed:
x-composio-signature→webhook-signature - ⚠️ Return type changed:
TriggerEvent→VerifyWebhookResult
Why?
- Cloudflare Workers compatibility - uses Web Crypto API instead of
node:crypto - Supports v1, v2, and v3 webhook formats with improved signature verification
Python: Signature Changed (v1/v2/v3 Support)
The method signature changed to support new webhook versions and requires additional headers.
Before:
from composio import Composio

composio = Composio()

# Old signature - fewer parameters
event = composio.triggers.verify_webhook(
    payload=request.get_data(as_text=True),
    signature=request.headers.get('x-composio-signature'),
    secret=os.environ['COMPOSIO_WEBHOOK_SECRET'],
)
# Returns: TriggerEvent
After:
from composio import Composio

composio = Composio()

# New signature - requires id and timestamp headers
result = composio.triggers.verify_webhook(
    id=request.headers.get('webhook-id'),           # NEW: required
    payload=request.get_data(as_text=True),
    secret=os.environ['COMPOSIO_WEBHOOK_SECRET'],
    signature=request.headers.get('webhook-signature'),  # header name changed
    timestamp=request.headers.get('webhook-timestamp'),  # NEW: required
    tolerance=300,  # optional
)
# Returns: VerifyWebhookResult with version info
Key Changes:
- ✅ Still synchronous (no
awaitneeded) - ⚠️ New required parameter:
id(webhook-id header) - ⚠️ New required parameter:
timestamp(webhook-timestamp header) - ⚠️ Header name changed:
x-composio-signature→webhook-signature - ⚠️ Return type changed:
TriggerEvent→VerifyWebhookResult - ⚠️ All parameters now keyword-only (must use
param=value)
Why? Supports v1, v2, and v3 webhook formats with improved signature verification.
2. Mastra v1 Provider Update
PR: #2433
The @composio/mastra provider has been updated to support Mastra v1, which has breaking API changes from v0.x.
Before (Mastra v0.x)
import { MastraProvider } from '@composio/mastra';
import { Mastra } from '@mastra/core';

const mastra = new Mastra({
  /* v0 config */
});
const provider = new MastraProvider();

// v0 API usage
const tools = await provider.wrapTools(composioTools);
After (Mastra v1)
import { MastraProvider } from '@composio/mastra';
import { Mastra } from '@mastra/core';

const mastra = new Mastra({
  /* v1 config */
});
const provider = new MastraProvider({ mastra });

// v1 API - different tool format
const tools = await provider.wrapTools(composioTools);
Changes Required
- Update Mastra dependency:
npm install @mastra/core@latest - Update provider initialization: Pass Mastra instance to provider
- Update tool handling: Mastra v1 uses different tool schema format
- Check Zod version: Mastra v1 supports both Zod v3 and v4
- Check Node.js version: Mastra v1 requires Node.js v22.13.0 or higher
We've added comprehensive E2E tests for both Zod v3 and v4 compatibility with Mastra v1 and Tool Router integration.
Major Features
3. Platform-Specific File Tool Modifier
PR: #2437
Separate implementations for Node.js and Cloudflare Workers to optimize file handling for each runtime.
Key Improvements:
- Node.js: Uses native file system APIs for better performance
- Cloudflare Workers: Uses platform-specific APIs, avoids Node.js-only code
- Automatic selection: SDK automatically picks the right implementation
- No code changes needed: Works transparently
Related Change: This platform-agnostic approach is why composio.triggers.verifyWebhook() became async in Breaking Change #1. Node.js node:crypto is mostly synchronous, but the standard globalThis.crypto (Web Crypto API) available in Cloudflare Workers is async. To support both platforms with a single API, the method had to become async.
4. Platform-Specific Config Defaults
PR: #2437
Different default configurations for different runtimes to optimize behavior.
Changed the autoUploadDownloadFiles default configuration for the Cloudflare Workers runtime, to avoid triggering runtime errors on unsupported features.
Cloudflare Workers defaults:
{
  autoUploadDownloadFiles: false; // We don't currently support file uploads/downloads in Cloudflare Workers
}
Removed in a later release. The autoUploadDownloadFiles flag described above was removed in the v0.8.0 / Python v0.12.0 release train. Automatic file handling is now off by default on every runtime, and you opt in with dangerouslyAllowAutoUploadDownloadFiles instead. See SDKs remove legacy automatic file handling config for the full migration.
Benefits:
- Zero config for common use cases
- Optimized for each platform's strengths
- Override defaults when needed
5. Node Buffer → Uint8Array Refactoring
PR: #2438
All node:buffer usage replaced with standard Uint8Array for universal compatibility.
Impact:
- Works in Node.js and Cloudflare Workers
- ESLint rules enforce this pattern going forward
- Better type safety with standard types
- Fully backward compatible - no code changes needed
Why This Matters: Removing Node.js-specific APIs like node:buffer and node:crypto enables Cloudflare Workers support. Cloudflare Workers don't have access to Node.js built-in modules, so we use Web Standard APIs (Uint8Array, globalThis.crypto) that work in both Node.js and Cloudflare Workers.
Bug Fixes
6. Tool Fetching with Specific Version
PR: #2518
Fixed issues when executing tools with version constraints.
Before (Bug)
// This would fail or fetch wrong version
await composio.tools.execute('GITHUB_CREATE_ISSUE', {
  userId: 'user_123',
  version: '1.2.0', // Version constraint ignored
  arguments: {
    /* ... */
  },
});
After (Fixed)
// Now correctly respects version constraint
await composio.tools.execute('GITHUB_CREATE_ISSUE', {
  userId: 'user_123',
  version: '1.2.0', // Version constraint honored
  arguments: {
    /* ... */
  },
});
Test Coverage: Added 174 new test cases to prevent regression.
7. Python JSON Schema Default Values
PR: #2506
Fixed type coercion for stringified default values in JSON schemas.
Before (Bug)
# Schema with stringified default
{
  "type": "integer",
  "default": "42"  # String instead of int
}

# Would cause runtime errors
After (Fixed)
# SDK automatically coerces to correct type
{
  "type": "integer",
  "default": 42  # Properly coerced to int
}

# Works correctlyImpact: Fixes runtime errors with tools that have stringified defaults in their schemas.
8. Salesforce Type Error Fix
PR: #2426
Fixed SALESFORCE_CREATE_LEAD type error with custom_fields parameter.
Before (Bug)
# Would fail with type error
composio.tools.execute('SALESFORCE_CREATE_LEAD', {
    'user_id': 'user_123',
    'arguments': {
        'custom_fields': {
            'CustomField__c': 'value'
        }
    }
})
After (Fixed)
# Now works correctly
composio.tools.execute('SALESFORCE_CREATE_LEAD', {
    'user_id': 'user_123',
    'arguments': {
        'custom_fields': {
            'CustomField__c': 'value'
        }
    }
})
Technical Details: Implemented proper support for anyOf and allOf JSON Schema constructs in Python SDK.
Migration Guide
Step 1: Update Dependencies
@composio/openai@latest npm update @composio/anthropic@latest npm update @composio/vercel@latest
# etc. ```
</Tab>
<Tab value="pnpm">
```bash pnpm update @composio/core@latest # Update provider packages if using them pnpm update
@composio/openai@latest pnpm update @composio/anthropic@latest pnpm update
@composio/vercel@latest # etc. ```
</Tab>
<Tab value="yarn">
```bash yarn upgrade @composio/core@latest # Update provider packages if using them yarn upgrade
@composio/openai@latest yarn upgrade @composio/anthropic@latest yarn upgrade
@composio/vercel@latest # etc. ```
</Tab>
<Tab value="pip">```bash pip install --upgrade composio ```</Tab>
<Tab value="uv">```bash uv pip install --upgrade composio ```</Tab>
</Tabs>

---

### Step 2: Update Webhook Verification (Required)

<Tabs groupId="language" items={['TypeScript', 'Python']} persist>
<Tab value="TypeScript">

**Update signature with new parameters and add `await`:**

```typescript
// @noErrors
// Before - old signature
const payload = composio.triggers.verifyWebhook({
payload: req.body.toString(),
signature: req.headers['x-composio-signature'] as string,
secret: process.env.COMPOSIO_WEBHOOK_SECRET!,
});

// After - new signature with await and additional parameters
const result = await composio.triggers.verifyWebhook({
id: req.headers['webhook-id'] as string, // NEW
payload: req.body.toString(),
secret: process.env.COMPOSIO_WEBHOOK_SECRET!,
signature: req.headers['webhook-signature'] as string, // header name changed
timestamp: req.headers['webhook-timestamp'] as string, // NEW
});

// Access the normalized payload and version info
const event = result.payload;
const version = result.version; // 'V1', 'V2', or 'V3'
Express.js Example:
import express from 'express';
import { Composio } from '@composio/core';

const app = express();
const composio = new Composio();

// Make route handler async
app.post('/webhook', express.raw({ type: 'application/json' }), async (req, res) => {
  try {
    // New signature with all required headers
    const result = await composio.triggers.verifyWebhook({
      id: req.headers['webhook-id'] as string,
      payload: req.body.toString(),
      secret: process.env.COMPOSIO_WEBHOOK_SECRET!,
      signature: req.headers['webhook-signature'] as string,
      timestamp: req.headers['webhook-timestamp'] as string,
    });

    // Access verified webhook data
    console.log('Webhook version:', result.version);
    console.log('Received trigger:', result.payload.triggerSlug);

    res.status(200).send('OK');
  } catch (error) {
    console.error('Webhook verification failed:', error);
    res.status(401).send('Unauthorized');
  }
});
Cloudflare Workers Example:
import { Composio } from '@composio/core';

export default {
  async fetch(request: Request, env: Env): Promise<Response> {
    const composio = new Composio({ apiKey: env.COMPOSIO_API_KEY });

    try {
      const body = await request.text();

      // Now works in Cloudflare Workers!
      const result = await composio.triggers.verifyWebhook({
        id: request.headers.get('webhook-id') || '',
        payload: body,
        secret: env.COMPOSIO_WEBHOOK_SECRET,
        signature: request.headers.get('webhook-signature') || '',
        timestamp: request.headers.get('webhook-timestamp') || '',
      });

      // Process verified webhook
      console.log('Trigger:', result.payload.triggerSlug);

      return new Response('OK', { status: 200 });
    } catch (error) {
      return new Response('Unauthorized', { status: 401 });
    }
  },
};
Step 3: Update Mastra Integration (If Using)
Only required if you use @composio/mastra provider
bash # Update to Mastra v1 npm install @mastra/core@latest @composio/mastra@latest
Update your code:
// Before
import { MastraProvider } from '@composio/mastra';

const provider = new MastraProvider();

// After
import { MastraProvider } from '@composio/mastra';
import { Mastra } from '@mastra/core';

const mastra = new Mastra({
  // Your Mastra v1 config
});

const provider = new MastraProvider({ mastra });
Zod Compatibility: Mastra v1 works with both Zod v3 and v4. We test both versions in CI to ensure compatibility.
Step 4: Test Your Integration
- Run your test suite to catch any issues
- Test webhook verification if you use triggers
- Test file uploads/downloads - behavior improved but API unchanged
- Test in your target runtime (Node.js, Cloudflare Workers, etc.)
Backward Compatibility
Fully Compatible (No Changes Needed)
The following features work without any code changes:
- ✅ All tool execution APIs
- ✅ Connected accounts management
- ✅ Authentication flows
- ✅ Custom tools
- ✅ Tool Router sessions
- ✅ File upload/download (API unchanged, implementation improved)
- ✅ All provider packages (except Mastra)
- ✅ Python SDK usage (except webhook verification)
Requires Changes
The following features require code updates:
- ⚠️ Webhook verification (TypeScript) - Must add
awaitAND addid+timestampparameters, update header names - ⚠️ Webhook verification (Python) - Must add
id+timestampparameters, update header names (still synchronous) - ⚠️ Mastra integration (TypeScript only) - Must update to v1 API
Impact Summary
| Change | TypeScript Breaking | Python Breaking | Migration Required | Effort |
|---|---|---|---|---|
| Webhook verification - TypeScript | ✅ Yes (async + signature) | N/A | ✅ Required | Medium - Add await + params |
| Webhook verification - Python | N/A | ✅ Yes (signature only) | ✅ Required | Low - Add parameters |
| Mastra v1 support | ✅ Yes | N/A | ✅ Required (if using) | Medium - Update API |
| Platform-specific file modifier | ❌ No | ❌ No | ❌ Optional | None - Automatic |
| Config defaults | ❌ No | ❌ No | ❌ Optional | None - Automatic |
| Buffer → Uint8Array | ❌ No | N/A | ❌ Optional | None - Automatic |
| Tool version fix | ❌ No | ❌ No | ❌ Optional | None - Automatic |
| JSON schema coercion | ❌ No | ❌ No | ❌ Optional | None - Automatic |
| Salesforce type fix | ❌ No | ❌ No | ❌ Optional | None - Automatic |
Cloudflare Workers Support
This release adds support for Cloudflare Workers:
import { Composio } from '@composio/core';

export default {
  async fetch(request: Request, env: Env): Promise<Response> {
    const composio = new Composio({
      apiKey: env.COMPOSIO_API_KEY,
    });

    // SDK now works in Cloudflare Workers!
    const tools = await composio.tools.get('user_123', {
      toolkits: ['github'],
    });

    const result = await composio.tools.execute('GITHUB_CREATE_ISSUE', {
      userId: 'user_123',
      arguments: {
        /* ... */
      },
    });

    return new Response(JSON.stringify(result));
  },
};
Key Features Working in Cloudflare Workers:
- ✅ Tool execution
- ✅ Connected accounts
- ✅ Webhook verification
- ✅ File upload/download
- ✅ Custom tools
Testing
This release includes extensive E2E testing:
- ✅ Node.js: Both CJS and ESM compatibility tests
- ✅ Cloudflare Workers: Multiple test suites including Tool Router
- ✅ Mastra v1: Tests for both Zod v3 and v4
- ✅ File handling: Comprehensive tests for all platforms
- ✅ Webhook verification: Tests for all supported runtimes
Total new tests: 200+ test cases added across TypeScript and Python SDKs.
Getting Help
If you encounter issues during migration:
- Check the docs: docs.composio.dev
- Join our Discord: discord.composio.dev
- Open an issue: github.com/ComposioHQ/composio/issues
- Email support: support@composio.dev
What's Next
Future releases will focus on:
- 🚀 Performance optimizations
- 🔧 More platform-specific improvements
- 📚 Enhanced TypeScript types
- 🛠️ New tool integrations
- 🔐 Advanced authentication flows
Stay tuned for updates!
Experimental Assistive Prompts and API Updates
Version Information
TypeScript/JavaScript
- Package:
@composio/core - Version:
0.5.5+
Python
- Package:
composio - Version:
0.10.10+
New Features
Experimental Assistive Prompt Configuration
Tool Router sessions now support experimental configuration for timezone-aware assistive prompts. When you provide a user's timezone, the session returns a contextual assistive prompt that includes timezone-specific guidance.
This is an experimental feature. The API may change or be removed in future versions.
from composio import Composio

composio = Composio()

session = composio.tool_router.create(
    user_id="user_123",
    toolkits=["github"],
    experimental={
        "assistive_prompt": {
            "user_timezone": "America/New_York",
        }
    },
)

# Access the generated assistive prompt
if session.experimental:
    print(session.experimental.assistive_prompt)
The experimental field is only available on sessions created with create(). Sessions retrieved with use() do not include the experimental data.
Toolkit Endpoint Method
The toolkit retrieve response now includes getCurrentUserEndpointMethod (TypeScript) / get_current_user_endpoint_method (Python) to indicate the HTTP method for the current user endpoint.
Breaking Changes
Trigger Pagination: page Replaced with cursor
The page parameter in listActive / list_active for trigger instances has been replaced with cursor for cursor-based pagination. There was a bug in earlier APIs which caused page param to be ignored, going ahead for pagination please use cursor instead.
# Before (deprecated)
triggers = composio.triggers.list_active(page=1, limit=10)

# After
triggers = composio.triggers.list_active(cursor="cursor_string", limit=10)
# Use response.next_cursor for the next page
Impact Summary
| Change | Runtime Breaking | TypeScript Breaking | Migration Required |
|---|---|---|---|
| Experimental assistive prompts | No | No | No |
getCurrentUserEndpointMethod field | No | No | No |
page → cursor in triggers | Yes | Yes | Yes (if using page) |
Migration Guide
If you are using the page parameter in listActive / list_active:
- Replace
pagewithcursor - For the first request, omit the
cursorparameter or passundefined/None - Use the
nextCursor/next_cursorfrom the response for subsequent requests
Connected Account Initiate Now Filters by ACTIVE Status
Version Information
TypeScript/JavaScript
- Package:
@composio/core - Version:
0.5.4+
Python
- Package:
composio - Version:
0.10.9+
The initiate() method now only considers ACTIVE connected accounts when checking for duplicates. Previously, expired or inactive accounts would incorrectly trigger the multiple accounts error.
What Changed
When calling connectedAccounts.initiate(), the SDK now filters by statuses: ["ACTIVE"] when checking for existing accounts. This prevents expired or inactive accounts from blocking new connection creation.
Before (Bug)
// Expired accounts would incorrectly trigger ComposioMultipleConnectedAccountsError
await composio.connectedAccounts.initiate(userId, authConfigId);
// ❌ Error: Multiple connected accounts found (even if they're all expired)
After (Fixed)
// Only ACTIVE accounts are considered
await composio.connectedAccounts.initiate(userId, authConfigId);
// ✅ Works - expired/inactive accounts are ignored
Affected SDKs
- TypeScript:
@composio/core - Python:
composio
Backward Compatibility
This is a bug fix with no breaking changes. The behavior now matches the expected intent of the multiple accounts check.
File Upload/Download Fixes for latest tool with anyOf, oneOf, and allOf Schemas
Version Information
TypeScript/JavaScript
- Package:
@composio/coreand provider packages - Version:
0.5.3+
Python
- Package:
composioand provider packages - Version:
0.10.8+
The file handling modifiers now properly handle file_uploadable and file_downloadable properties nested within anyOf, oneOf, and allOf JSON Schema declarations. Previously, only direct child properties (and partial allOf support) were detected for file upload/download transformations.
We recommend updating to version 0.5.3 (TypeScript) or 0.10.8 (Python) or later to ensure file uploads and downloads work correctly with tools that use union or intersection types in their schemas.
What Changed
Before (Bug)
File properties inside anyOf, oneOf, or allOf were not detected:
// This schema's file_uploadable was NOT being processed
inputParameters: {
  type: 'object',
  properties: {
    fileInput: {
      anyOf: [
        {
          type: 'string',
          file_uploadable: true  // ❌ Not detected
        },
        {
          type: 'null'
        }
      ]
    }
  }
}
After (Fixed)
File properties are now correctly detected and processed at any nesting level:
// Now properly detected and transformed
inputParameters: {
  type: 'object',
  properties: {
    fileInput: {
      anyOf: [
        {
          type: 'string',
          file_uploadable: true  // ✅ Detected and processed
        },
        {
          type: 'null'
        }
      ]
    }
  }
}
Affected Scenarios
| Scenario | Before | After |
|---|---|---|
file_uploadable in anyOf | Not detected | ✅ Works |
file_uploadable in oneOf | Not detected | ✅ Works |
file_uploadable in allOf | Not detected | ✅ Works |
file_downloadable in anyOf | Not detected | ✅ Works |
file_downloadable in oneOf | Not detected | ✅ Works |
file_downloadable in allOf | Not detected | ✅ Works |
| Nested objects inside union types | Not detected | ✅ Works |
| Array items with union types | Not detected | ✅ Works |
How to Update
TypeScript/JavaScript
npm update @composio/core@latestPython
pip install --upgrade composioBackward Compatibility
This release is fully backward compatible:
- All existing code continues to work without modifications
- No migration required
- File upload/download for direct properties continues to work as before
- The fix only adds support for previously unsupported schema patterns
Impact Summary
| Change | Runtime Breaking | TypeScript Breaking | Migration Required |
|---|---|---|---|
anyOf support for file uploads | No | No | No |
oneOf support for file uploads | No | No | No |
allOf support for file uploads | No | No | No |
anyOf support for file downloads | No | No | No |
oneOf support for file downloads | No | No | No |
allOf support for file downloads | No | No | No |
File handling in tool execution now uses presigned URLs
Summary
Files involved in tool execution are now shared via presigned URLs with a default TTL (time-to-live) of 1 hour. You can customize the file TTL through your project configuration.
What changed
When tools return files (images, documents, exports, etc.), these files are now delivered as presigned URLs with a configurable TTL instead of non-expiring URLs. This provides:
- Automatic cleanup - Files expire after the configured TTL
- Configurable retention - Adjust file availability based on your application's needs
Default behavior
All files returned from tool execution now have a 1 hour TTL by default. After this period, the presigned URLs expire and files are no longer accessible.
Configuring file TTL
You can adjust the file TTL to match your application's needs.
Via Dashboard
- Navigate to Project Settings in your Composio dashboard
- Find the File TTL configuration option
- Set your desired TTL value
Via API
Use the Update Project Config API to programmatically configure the file TTL:
curl -X PATCH "https://backend.composio.dev/api/v3/org/projects/config" \
  -H "x-api-key: YOUR_API_KEY" \
  -H "Content-Type: application/json" \
  -d '{
    "fileTtl": 3600
  }'
Impact
| Aspect | Before | After |
|---|---|---|
| File delivery | Non-expiring URLs | Presigned URLs with TTL |
| Default expiry | None | 1 hour |
| TTL customization | Not available | Configurable via project settings |
Migration
No code changes are required. Your existing integrations will continue to receive file URLs as before, but these URLs will now expire after the configured TTL.
If your application stores or caches file URLs for later use, ensure you handle URL expiration appropriately by either:
- Downloading files before the TTL expires
- Re-executing the tool to obtain fresh URLs when needed
- Increasing the TTL via project settings to match your retention requirements
True PATCH Semantics for Auth Config Updates
Version Information
TypeScript/JavaScript
- Package:
@composio/coreand provider packages - Version:
0.5.1+
Python
- Package:
composio-coreand provider packages - Version:
0.10.7+
The PATCH /api/v3/auth_configs/{id} endpoint now implements proper partial update semantics. Previously, omitting fields would clear them (behaving like PUT). Now, omitted fields are preserved—only explicitly provided fields are modified.
Breaking Change: If you relied on omitting fields to clear them, you must now explicitly send null or []. See Migration Guide below.
What Changed
| Field | Before (Buggy) | After (Correct) |
|---|---|---|
credentials | Required on every update | Optional—merged with existing |
tool_access_config | Reset to {} if omitted | Preserved if omitted |
scopes (type: default) | Cleared if omitted | Preserved if omitted |
restrict_to_following_tools | Reset to [] if omitted | Preserved if omitted |
Merge Behavior: The credentials object is merged—send only the fields you want to change, and existing fields are preserved.
New Capabilities
Rotate a Single Credential Field
Update just client_secret without resending client_id or other fields:
from composio import Composio

composio = Composio()

# Only send the field you want to update - other credentials are preserved

composio.auth_configs.update(
    "ac_yourAuthConfigId",
    options={
        "type": "custom",
        "credentials": {
            "client_secret": "new_rotated_secret",
        },
    },
)
Update Tool Restrictions Without Touching Credentials
Previously, this would fail because credentials was required. Now it works:
from composio import Composio

composio = Composio()

# Update tool restrictions - credentials are automatically preserved

composio.auth_configs.update(
    "ac_yourAuthConfigId",
    options={
        "type": "custom",
        "tool_access_config": {
            "tools_available_for_execution": ["GMAIL_SEND_EMAIL", "GMAIL_READ_EMAIL"],
        },
    },
)
Migration Guide
Am I Affected?
Yes, if your code relied on omitting fields to clear them.
No, if you always send complete payloads or only use PATCH to update specific fields.
How to Clear Fields Explicitly
| To Clear | Python SDK | TypeScript SDK |
|---|---|---|
tool_access_config | "tool_access_config": {"tools_available_for_execution": []} | toolAccessConfig: { toolsAvailableForExecution: [] } |
scopes (default) | "scopes": "" | scopes: "" (via HTTP API) |
from composio import Composio

composio = Composio()

# Explicitly clear tool restrictions with empty array

composio.auth_configs.update(
    "ac_yourAuthConfigId",
    options={
        "type": "custom",
        "tool_access_config": {
            "tools_available_for_execution": [],
        },
    },
)
Raw HTTP API
For users calling the API directly:
# Rotate single credential
curl -X PATCH "https://backend.composio.dev/api/v3/auth_configs/{id}" \
  -H "x-api-key: YOUR_API_KEY" \
  -H "Content-Type: application/json" \
  -d '{"type": "custom", "credentials": {"client_secret": "new_secret"}}'

# Clear tool restrictions
curl -X PATCH "https://backend.composio.dev/api/v3/auth_configs/{id}" \
  -H "x-api-key: YOUR_API_KEY" \
  -H "Content-Type: application/json" \
-d '{"type": "custom", "tool_access_config": {"tools_available_for_execution": []}}'Tool Router Improvements and New Features
Version Information
TypeScript/JavaScript
- Package:
@composio/coreand provider packages - Version:
0.3.4to0.4.0
Python
- Package:
composio-coreand provider packages - Version:
0.10.4to0.10.5
New Features
1. Wait for Connections Property
Added waitForConnections (TypeScript) / wait_for_connections (Python) property to manage connections configuration. This allows tool router sessions to wait for users to complete authentication before proceeding to the next step.
TypeScript:
const session = await composio.toolRouter.create(userId, {
  manageConnections: {
    enable: true,
    callbackUrl: 'https://example.com/callback',
    waitForConnections: true  // NEW
  }
});
Python:
session = tool_router.create(
    user_id="user_123",
    manage_connections={
        "enable": True,
        "callback_url": "https://example.com/callback",
        "wait_for_connections": True  # NEW
    }
)
2. Session-Specific Modifier Types
Introduced new modifier types for better session-based tool execution: SessionExecuteMetaModifiers and SessionMetaToolOptions.
TypeScript:
const tools = await session.tools({
  modifySchema: ({ toolSlug, toolkitSlug, schema }) => schema,
  beforeExecute: ({ toolSlug, toolkitSlug, sessionId, params }) => params,
  afterExecute: ({ toolSlug, toolkitSlug, sessionId, result }) => result
});
Python:
from composio.core.models import before_execute_meta, after_execute_meta

@before_execute_meta
def before_modifier(tool, toolkit, session_id, params):
    return params

@after_execute_meta
def after_modifier(tool, toolkit, session_id, response):
    return response

tools = session.tools(modifiers=[before_modifier, after_modifier])
3. Dedicated Method for Tool Router Meta Tools
Added getRawToolRouterMetaTools (TypeScript) / get_raw_tool_router_meta_tools (Python) method in the Tools class for fetching meta tools directly from a tool router session.
TypeScript:
const metaTools = await composio.tools.getRawToolRouterMetaTools('session_123', {
  modifySchema: ({ toolSlug, toolkitSlug, schema }) => {
    // Customize schema
    return schema;
  }
});
Python:
meta_tools = tools_model.get_raw_tool_router_meta_tools(
    session_id="session_123",
    modifiers=[schema_modifier]
)
Internal Improvements
1. Performance Optimization
Eliminated unnecessary tool fetching during tool router execution, resulting in faster tool execution with fewer API calls.
2. Improved Architecture
Tool router sessions now fetch tools directly from the session API endpoint instead of using tool slugs, providing better consistency and reliability.
3. Simplified Implementation
Removed redundant tool schema fetching in execution paths, using a hardcoded 'composio' toolkit slug for meta tools.
Backward Compatibility
This release is fully backward compatible:
- All existing code continues to work without modifications
- New properties are optional with sensible defaults
- New modifier types can be adopted incrementally
- Internal changes have no impact on public APIs
- No migration required
Impact Summary
| Change | Runtime Breaking | TypeScript Breaking | Migration Required |
|---|---|---|---|
wait_for_connections property | No | No | No |
| Session-specific modifiers | No | No | No |
getRawToolRouterMetaTools method | No | No | No |
| Tool router uses session API | No | No | No |
| Optimized tool execution | No | No | No |
All changes follow semantic versioning principles and maintain full backward compatibility.
Tool Enum Name Shortening
Shortened tool enum names across 181 actions to ensure compatibility with all AI agent frameworks.
Why This Change?
Some agent frameworks have a 64-character limit on tool/function names. Several tool enums exceeded this limit, causing compatibility issues.
No Action Required
This change will not break your integration if you are using latest toolkit versions or fetching tools dynamically. The SDK automatically resolves the correct tool names.
View All Enum Changes (181 tools)
| Old Enum | New Enum |
|---|---|
ACTIVE_TRAIL_GET_ACCOUNT_INTEGRATIONDATA_ACTIVECOMMERCE | ACTIVE_TRAIL_GET_ACCOUNT_INTEGRATIONDATA |
ACTIVE_TRAIL_GET_AUTOMATION_REPORTS_SMS_CAMPAIGN_SUMMARY_REPORT | ACTIVE_TRAIL_GET_AUTOMATION_REPORTS_SMS_CAMPAIGN_SUMMARY |
BIG_DATA_CLOUD_REVERSE_GEOCODING_WITH_TIMEZONE_API | BIG_DATA_CLOUD_REVERSE_GEOCODING_TIMEZONE_API |
CLICKSEND_RECHARGE_TRANSACTIONS_BY_TRANSACTION_ID_GET | CLICKSEND_RECHARGE_TXNS_BY_TXN_ID_GET |
CODEMAGIC_API_V3_VARIABLE_GROUPS_VARIABLE_GROUP_ID_UPDATE_GROUP | CODEMAGIC_API_V3_VARIABLE_GROUPS_VARIABLE_GROUP_ID_UPDATE |
COUPA_GET_ALL_FUNDS_TRANSFERS_IN_A_SPECIFIC_PAYMENT_BATCH_BY_PAYMENT_BATCH_ID | COUPA_GET_ALL_FUNDS_TRANSFERS_SPECIFIC_PAYMENT_BATCH |
COUPA_GET_PO_CONFIRMATION_IN_CANCELLED_STATUS_AND_NOT_EXPORTED | COUPA_GET_PO_CONFIRMATION_CANCELLED_STATUS_NOT_EXPORTED |
DATABRICKS_CATALOG_CREDENTIALS_GENERATE_TEMPORARY_SERVICE_CREDENTIAL | DATABRICKS_CATALOG_CREDS_GENERATE_TEMP_SERVICE_CRED |
DATABRICKS_CATALOG_CREDENTIALS_VALIDATE_CREDENTIAL | DATABRICKS_CATALOG_CREDS_VALIDATE_CRED |
DATABRICKS_CATALOG_EXTERNAL_METADATA_UPDATE_EXTERNAL_METADATA | DATABRICKS_CATALOG_EXTERNAL_METADATA_UPDATE_EXTERNAL |
DATABRICKS_CATALOG_RFA_GET_ACCESS_REQUEST_DESTINATIONS | DATABRICKS_CATALOG_RFA_GET_ACCESS_REQUEST_DESTS |
DATABRICKS_CATALOG_RFA_UPDATE_ACCESS_REQUEST_DESTINATIONS | DATABRICKS_CATALOG_RFA_UPDATE_ACCESS_REQUEST_DESTS |
DATABRICKS_CATALOG_TEMPORARY_PATH_CREDENTIALS_GENERATE_TEMPORARY_PATH_CREDENTIALS | DATABRICKS_CATALOG_TEMP_PATH_CREDS_GENERATE_TEMP_PATH_CREDS |
DATABRICKS_COMPUTE_CLUSTER_POLICIES_GET_PERMISSION_LEVELS | DATABRICKS_COMPUTE_CLUSTER_POLICIES_GET_PERM_LEVELS |
DATABRICKS_COMPUTE_CLUSTER_POLICIES_GET_PERMISSIONS | DATABRICKS_COMPUTE_CLUSTER_POLICIES_GET_PERMS |
DATABRICKS_COMPUTE_CLUSTER_POLICIES_SET_PERMISSIONS | DATABRICKS_COMPUTE_CLUSTER_POLICIES_SET_PERMS |
DATABRICKS_COMPUTE_CLUSTER_POLICIES_UPDATE_PERMISSIONS | DATABRICKS_COMPUTE_CLUSTER_POLICIES_UPDATE_PERMS |
DATABRICKS_COMPUTE_INSTANCE_POOLS_GET_PERMISSION_LEVELS | DATABRICKS_COMPUTE_INSTANCE_POOLS_GET_PERM_LEVELS |
DATABRICKS_COMPUTE_INSTANCE_POOLS_UPDATE_PERMISSIONS | DATABRICKS_COMPUTE_INSTANCE_POOLS_UPDATE_PERMS |
DATABRICKS_COMPUTE_POLICY_COMPLIANCE_FOR_CLUSTERS_ENFORCE_COMPLIANCE | DATABRICKS_COMPUTE_POLICY_COMPL_FOR_CLUSTERS_ENFORCE_COMPL |
DATABRICKS_COMPUTE_POLICY_COMPLIANCE_FOR_CLUSTERS_GET_COMPLIANCE | DATABRICKS_COMPUTE_POLICY_COMPL_FOR_CLUSTERS_GET_COMPL |
DATABRICKS_DASHBOARDS_GENIE_DELETE_CONVERSATION_MESSAGE | DATABRICKS_DASHBOARDS_GENIE_DELETE_CONV_MESSAGE |
DATABRICKS_DASHBOARDS_GENIE_EXECUTE_MESSAGE_ATTACHMENT_QUERY | DATABRICKS_DASHBOARDS_GENIE_EXECUTE_MESSAGE_ATTACH_QUERY |
DATABRICKS_DASHBOARDS_GENIE_GET_MESSAGE_ATTACHMENT_QUERY_RESULT | DATABRICKS_DASHBOARDS_GENIE_GET_MESSAGE_ATTACH_QUERY_RESULT |
DATABRICKS_DASHBOARDS_GENIE_GET_MESSAGE_QUERY_RESULT_BY_ATTACHMENT | DATABRICKS_DASHBOARDS_GENIE_GET_MESSAGE_QUERY_RESULT_ATTACH |
DATABRICKS_DASHBOARDS_GENIE_LIST_CONVERSATION_MESSAGES | DATABRICKS_DASHBOARDS_GENIE_LIST_CONV_MESSAGES |
DATABRICKS_DASHBOARDS_LAKEVIEW_EMBEDDED_GET_PUBLISHED_DASHBOARD_TOKEN_INFO | DATABRICKS_DASHBOARDS_LAKEVIEW_EMBEDDED_GET_PUBLISHED_DASH |
DATABRICKS_DATABASE_DATABASE_GENERATE_DATABASE_CREDENTIAL | DATABRICKS_DATABASE_DATABASE_GENERATE_DATABASE_CRED |
DATABRICKS_IAM_PERMISSION_MIGRATION_MIGRATE_PERMISSIONS | DATABRICKS_IAM_PERM_MIGRATION_MIGRATE_PERMS |
DATABRICKS_IAMV2_WORKSPACE_IAM_V2_GET_WORKSPACE_ACCESS_DETAIL_LOCAL | DATABRICKS_IAMV2_WORKSPACE_IAM_V2_GET_WORKSPACE_ACCESS |
DATABRICKS_JOB_PERMISSION_LEVELS_GETPERMISSIONLEVELS | DATABRICKS_JOB_PERM_LEVELS_GETPERMISSIONLEVELS |
DATABRICKS_JOBS_POLICY_COMPLIANCE_FOR_JOBS_GET_COMPLIANCE | DATABRICKS_JOBS_POLICY_COMPL_FOR_JOBS_GET_COMPL |
DATABRICKS_MARKETPLACE_CONSUMER_INSTALLATIONS_CREATE | DATABRICKS_MKTPLACE_CONSUMER_INSTALLATIONS_CREATE |
DATABRICKS_MARKETPLACE_CONSUMER_INSTALLATIONS_DELETE | DATABRICKS_MKTPLACE_CONSUMER_INSTALLATIONS_DELETE |
DATABRICKS_MARKETPLACE_CONSUMER_INSTALLATIONS_UPDATE | DATABRICKS_MKTPLACE_CONSUMER_INSTALLATIONS_UPDATE |
DATABRICKS_MARKETPLACE_CONSUMER_LISTINGS_BATCH_GET | DATABRICKS_MKTPLACE_CONSUMER_LISTINGS_BATCH_GET |
DATABRICKS_MARKETPLACE_CONSUMER_PERSONALIZATION_REQUESTS_GET | DATABRICKS_MKTPLACE_CONSUMER_PERSONALIZATION_REQUESTS_GET |
DATABRICKS_MARKETPLACE_CONSUMER_PROVIDERS_BATCH_GET | DATABRICKS_MKTPLACE_CONSUMER_PROVIDERS_BATCH_GET |
DATABRICKS_MARKETPLACE_PROVIDER_EXCHANGES_DELETE_LISTING_FROM_EXCHANGE | DATABRICKS_MKTPLACE_PROVIDER_EXCHANGES_DELETE_LISTING |
DATABRICKS_MARKETPLACE_PROVIDER_PROVIDER_ANALYTICS_DASHBOARDS_CREATE | DATABRICKS_MKTPLACE_PROVIDER_ANALYTICS_DASHBOARDS_CREATE |
DATABRICKS_MARKETPLACE_PROVIDER_PROVIDER_ANALYTICS_DASHBOARDS_GET | DATABRICKS_MKTPLACE_PROVIDER_ANALYTICS_DASHBOARDS_GET |
DATABRICKS_MARKETPLACE_PROVIDER_PROVIDER_ANALYTICS_DASHBOARDS_GET_LATEST_VERSION | DATABRICKS_MKTPLACE_PROVIDER_ANALYTICS_DASH_GET_LATEST |
DATABRICKS_ML_FEATURE_ENGINEERING_DELETE_KAFKA_CONFIG | DATABRICKS_ML_FEATURE_ENG_DELETE_KAFKA_CONFIG |
DATABRICKS_ML_MATERIALIZED_FEATURES_DELETE_FEATURE_TAG | DATABRICKS_ML_MAT_FEATURES_DELETE_FEATURE_TAG |
DATABRICKS_ML_MATERIALIZED_FEATURES_GET_FEATURE_TAG | DATABRICKS_ML_MAT_FEATURES_GET_FEATURE_TAG |
DATABRICKS_ML_MATERIALIZED_FEATURES_UPDATE_FEATURE_TAG | DATABRICKS_ML_MAT_FEATURES_UPDATE_FEATURE_TAG |
DATABRICKS_ML_MODEL_REGISTRY_GET_PERMISSION_LEVELS | DATABRICKS_ML_MODEL_REGISTRY_GET_PERM_LEVELS |
DATABRICKS_PIPELINES_PIPELINES_GET_PERMISSION_LEVELS | DATABRICKS_PIPELINES_PIPELINES_GET_PERM_LEVELS |
DATABRICKS_QUALITYMONITORV2_QUALITY_MONITOR_V2_CREATE_QUALITY_MONITOR | DATABRICKS_QUALITYMONITORV2_QUALITY_MONITOR_V2_CREATE |
DATABRICKS_SERVING_SERVING_ENDPOINTS_CREATE_PROVISIONED_THROUGHPUT_ENDPOINT | DATABRICKS_SERVING_SERVING_ENDPOINTS_CREATE_PROV_THPUT |
DATABRICKS_SERVING_SERVING_ENDPOINTS_GET_PERMISSION_LEVELS | DATABRICKS_SERVING_SERVING_ENDPOINTS_GET_PERM_LEVELS |
DATABRICKS_SETTINGS_AIBI_DASHBOARD_EMBEDDING_ACCESS_POLICY_DELETE | DATABRICKS_SETTINGS_AIBI_DASH_EMBEDDING_ACCESS_POLICY_DELETE |
DATABRICKS_SETTINGS_AIBI_DASHBOARD_EMBEDDING_ACCESS_POLICY_GET | DATABRICKS_SETTINGS_AIBI_DASH_EMBEDDING_ACCESS_POLICY_GET |
DATABRICKS_SETTINGS_AIBI_DASHBOARD_EMBEDDING_ACCESS_POLICY_UPDATE | DATABRICKS_SETTINGS_AIBI_DASH_EMBEDDING_ACCESS_POLICY_UPDATE |
DATABRICKS_SETTINGS_AIBI_DASHBOARD_EMBEDDING_APPROVED_DOMAINS_DELETE | DATABRICKS_SETTINGS_AIBI_DASH_EMBEDDING_DOMAINS_DELETE |
DATABRICKS_SETTINGS_AIBI_DASHBOARD_EMBEDDING_APPROVED_DOMAINS_GET | DATABRICKS_SETTINGS_AIBI_DASH_EMBEDDING_APPROVED_DOMAINS_GET |
DATABRICKS_SETTINGS_AIBI_DASHBOARD_EMBEDDING_APPROVED_DOMAINS_UPDATE | DATABRICKS_SETTINGS_AIBI_DASH_EMBEDDING_DOMAINS_UPDATE |
DATABRICKS_SETTINGS_COMPLIANCE_SECURITY_PROFILE_GET | DATABRICKS_SETTINGS_COMPL_SECURITY_PROFILE_GET |
DATABRICKS_SETTINGS_DASHBOARD_EMAIL_SUBSCRIPTIONS_DELETE | DATABRICKS_SETTINGS_DASH_EMAIL_SUBS_DELETE |
DATABRICKS_SETTINGS_DASHBOARD_EMAIL_SUBSCRIPTIONS_GET | DATABRICKS_SETTINGS_DASH_EMAIL_SUBS_GET |
DATABRICKS_SETTINGS_DASHBOARD_EMAIL_SUBSCRIPTIONS_UPDATE | DATABRICKS_SETTINGS_DASH_EMAIL_SUBS_UPDATE |
DATABRICKS_SETTINGS_ENABLE_EXPORT_NOTEBOOK_GET_ENABLE_EXPORT_NOTEBOOK | DATABRICKS_SETTINGS_ENABLE_EXPORT_NOTEBOOK_GET_ENABLE |
DATABRICKS_SETTINGS_ENABLE_EXPORT_NOTEBOOK_PATCH_ENABLE_EXPORT_NOTEBOOK | DATABRICKS_SETTINGS_ENABLE_EXPORT_NOTEBOOK_PATCH_ENABLE |
DATABRICKS_SETTINGS_ENABLE_NOTEBOOK_TABLE_CLIPBOARD_GET_ENABLE_NOTEBOOK_TABLE_CLIPBOARD | DATABRICKS_SETTINGS_ENABLE_NOTEBOOK_TABLE_CLIPBOARD_GET |
DATABRICKS_SETTINGS_ENABLE_NOTEBOOK_TABLE_CLIPBOARD_PATCH_ENABLE_NOTEBOOK_TABLE_CLIPBOARD | DATABRICKS_SETTINGS_ENABLE_NOTEBOOK_TABLE_CLIPBOARD_PATCH |
DATABRICKS_SETTINGS_ENABLE_RESULTS_DOWNLOADING_GET_ENABLE_RESULTS_DOWNLOADING | DATABRICKS_SETTINGS_ENABLE_RESULTS_DOWNLOADING_GET_ENABLE |
DATABRICKS_SETTINGS_LLM_PROXY_PARTNER_POWERED_WORKSPACE_DELETE | DATABRICKS_SETTINGS_LLM_PROXY_PARTNER_WORKSPACE_DELETE |
DATABRICKS_SETTINGS_LLM_PROXY_PARTNER_POWERED_WORKSPACE_UPDATE | DATABRICKS_SETTINGS_LLM_PROXY_PARTNER_WORKSPACE_UPDATE |
DATABRICKS_SETTINGS_NOTIFICATION_DESTINATIONS_CREATE | DATABRICKS_SETTINGS_NOTIF_DESTS_CREATE |
DATABRICKS_SETTINGS_NOTIFICATION_DESTINATIONS_DELETE | DATABRICKS_SETTINGS_NOTIF_DESTS_DELETE |
DATABRICKS_SETTINGS_NOTIFICATION_DESTINATIONS_UPDATE | DATABRICKS_SETTINGS_NOTIF_DESTS_UPDATE |
DATABRICKS_SETTINGS_TOKEN_MANAGEMENT_GET_PERMISSION_LEVELS | DATABRICKS_SETTINGS_TOKEN_MGMT_GET_PERM_LEVELS |
DATABRICKS_SETTINGS_TOKEN_MANAGEMENT_GET_PERMISSIONS | DATABRICKS_SETTINGS_TOKEN_MGMT_GET_PERMS |
DATABRICKS_SETTINGS_TOKEN_MANAGEMENT_SET_PERMISSIONS | DATABRICKS_SETTINGS_TOKEN_MGMT_SET_PERMS |
DATABRICKS_SETTINGS_TOKEN_MANAGEMENT_UPDATE_PERMISSIONS | DATABRICKS_SETTINGS_TOKEN_MGMT_UPDATE_PERMS |
DATABRICKS_SETTINGSV2_WORKSPACE_SETTINGS_V2_GET_PUBLIC_WORKSPACE_SETTING | DATABRICKS_SETTINGSV2_WORKSPACE_SETTINGS_V2_GET_PUBLIC |
DATABRICKS_SQL_STATEMENT_EXECUTION_CANCEL_EXECUTION | DATABRICKS_SQL_STATEMENT_EXEC_CANCEL_EXEC |
DATABRICKS_VECTORSEARCH_VECTOR_SEARCH_ENDPOINTS_CREATE_ENDPOINT | DATABRICKS_VECTORSEARCH_VECTOR_SEARCH_ENDPOINTS_CREATE |
DATABRICKS_VECTORSEARCH_VECTOR_SEARCH_INDEXES_UPSERT_DATA_VECTOR_INDEX | DATABRICKS_VECTORSEARCH_VECTOR_SEARCH_INDEXES_UPSERT_DATA |
DEPLOYHQ_DELETE_PROJECTS_PROJECT_BUILD_CACHE_FILES_IDENTIFIER | DEPLOYHQ_DELETE_PROJECTS_PROJECT_BUILD_CACHE_FILES |
DROPBOX_SIGN_EDIT_AND_RESEND_EMBEDDED_SIGNATURE_REQUEST_WITH_TEMPLATE | DROPBOX_SIGN_EDIT_RESEND_EMBEDDED_SIGNATURE_REQUEST_TEMPLATE |
GITHUB_CREATE_OR_UPDATE_CUSTOM_PROPERTIES_FOR_AN_ORGANIZATION | GITHUB_CREATE_OR_UPDATE_CUSTOM_PROPERTIES_FOR_AN_ORG |
GOOGLE_ANALYTICS_ANALYTICS_ADMIN_PROPERTIES_BIG_QUERY_LINKS_LIST | GOOGLE_ANALYTICS_ANALYTICS_ADMIN_PROPERTIES_BIG_QUERY_LINKS |
GOOGLE_ANALYTICS_ANALYTICSADMIN_PROPERTIES_CHANNELGROUPS_LIST | GOOGLE_ANALYTICS_ANALYTICSADMIN_PROPERTIES_CHANNELGROUPS |
GOOGLE_ANALYTICS_ANALYTICSADMIN_PROPERTIES_CONVERSIONEVENTS_LIST | GOOGLE_ANALYTICS_ANALYTICSADMIN_PROPERTIES_CONVERSIONEVENTS |
GOOGLE_ANALYTICS_ANALYTICSADMIN_PROPERTIES_CUSTOMDIMENSIONS_LIST | GOOGLE_ANALYTICS_ANALYTICSADMIN_PROPERTIES_CUSTOMDIMENSIONS |
GOOGLE_ANALYTICS_ANALYTICSADMIN_PROPERTIES_DATASTREAMS_MEASUREMENTPROTOCOLSECRETS_LIST | GOOGLE_ANALYTICS_ANALYTICSADMIN_PROPERTIES_DATASTREAMS |
GOOGLE_ANALYTICS_ANALYTICS_ADMIN_PROPERTIES_DISPLAY_VIDEO360_ADVERTISER_LINK_PROPOSALS_LIST | GOOGLE_ANALYTICS_ADMIN_PROPS_DV360_LINK_PROPOSALS_LIST |
GOOGLE_ANALYTICS_ANALYTICS_ADMIN_PROPERTIES_DISPLAY_VIDEO360_ADVERTISER_LINKS_LIST | GOOGLE_ANALYTICS_ADMIN_PROPS_DV360_AD_LINKS_LIST |
GOOGLE_ANALYTICS_ANALYTICSADMIN_PROPERTIES_EXPANDEDDATASETS_LIST | GOOGLE_ANALYTICS_ANALYTICSADMIN_PROPERTIES_EXPANDEDDATASETS |
GOOGLE_ANALYTICS_ANALYTICSADMIN_PROPERTIES_FIREBASELINKS_LIST | GOOGLE_ANALYTICS_ANALYTICSADMIN_PROPERTIES_FIREBASELINKS |
GOOGLE_ANALYTICS_ANALYTICS_ADMIN_PROPERTIES_GOOGLE_ADS_LINKS_LIST | GOOGLE_ANALYTICS_ANALYTICS_ADMIN_PROPERTIES_GOOGLE_ADS |
GOOGLE_ANALYTICS_ANALYTICS_ADMIN_PROPERTIES_SEARCH_ADS360_LINKS_LIST | GOOGLE_ANALYTICS_ANALYTICS_ADMIN_PROPERTIES_SEARCH_ADS360 |
GOOGLE_ANALYTICS_PROPERTIES_DATASTREAMS_EVENTCREATERULES_LIST_ACTION | GOOGLE_ANALYTICS_PROPERTIES_DATASTREAMS_EVENTCREATERULES |
GOOGLE_CLASSROOM_COURSES_ANNOUNCEMENTS_ADD_ON_ATTACHMENTS_DELETE | GOOGLE_CLASSROOM_COURSES_ANNOUNCES_ADD_ON_ATTACHS_DELETE |
GOOGLE_CLASSROOM_COURSES_ANNOUNCEMENTS_ADD_ON_ATTACHMENTS_GET | GOOGLE_CLASSROOM_COURSES_ANNOUNCES_ADD_ON_ATTACHS_GET |
GOOGLE_CLASSROOM_COURSES_ANNOUNCEMENTS_ADD_ON_ATTACHMENTS_LIST | GOOGLE_CLASSROOM_COURSES_ANNOUNCES_ADD_ON_ATTACHS_LIST |
GOOGLE_CLASSROOM_COURSES_COURSE_WORK_ADD_ON_ATTACHMENTS_DELETE | GOOGLE_CLASSROOM_COURSES_COURSE_WORK_ADD_ON_ATTACHS_DELETE |
GOOGLE_CLASSROOM_COURSES_COURSE_WORK_MATERIALS_ADD_ON_ATTACHMENTS_LIST | GOOGLE_CLASSROOM_COURSES_COURSE_WORK_MATERIALS_ADD_ATTACHS |
GOOGLE_CLASSROOM_COURSES_COURSE_WORK_MATERIALS_GET_ADD_ON_CONTEXT | GOOGLE_CLASSROOM_COURSES_COURSE_WORK_MATERIALS_GET_ADD |
INSTANTLY_DFY_EMAIL_ACCOUNT_ORDERS_DOMAINS_PRE_WARMED_UP_LIST_POST | INSTANTLY_DFY_EMAIL_ACCOUNT_ORDERS_DOMAINS_PRE_WARMED_UP |
INSTANTLY_LIST_INBOX_PLACEMENT_BLACKLIST_AND_SPAM_ASSASSIN_REPORTS | INSTANTLY_LIST_INBOX_PLACEMENT_BLACKLIST_SPAM_ASSASSIN |
METABASE_DELETE_API_USER_KEY_VALUE_NAMESPACE_NAMESPACE_KEY_KEY | METABASE_DELETE_API_USER_KEY_VALUE_NAMESPACE_NAMESPACE_KEY |
METABASE_GET_API_AUTOMAGIC_DASHBOARDS_DATABASE_ID_CANDIDATES | METABASE_GET_API_AUTO_DASHBOARDS_DATABASE_ID_CANDIDATES |
METABASE_GET_API_AUTOMAGIC_DASHBOARDS_ENTITY_ENTITY_ID_OR_QUERY_CELL_CELL_QUERY | METABASE_GET_AUTOMAGIC_DASH_ENTITY_CELL_QUERY |
METABASE_GET_API_AUTOMAGIC_DASHBOARDS_ENTITY_ENTITY_ID_OR_QUERY_CELL_CELL_QUERY_RULE_PREFIX | METABASE_GET_AUTOMAGIC_DASH_ENTITY_CELL_QUERY_RULE |
METABASE_GET_API_AUTOMAGIC_DASHBOARDS_ENTITY_ENTITY_ID_OR_QUERY_QUERY_METADATA | METABASE_GET_AUTOMAGIC_DASH_ENTITY_QUERY_METADATA |
METABASE_GET_API_DASHBOARD_ID_PARAMS_PARAM_KEY_REMAPPING | METABASE_GET_API_DASH_ID_PARAMS_PARAM_KEY_REMAPPING |
METABASE_GET_API_DASHBOARD_ID_PARAMS_PARAM_KEY_VALUES | METABASE_GET_API_DASH_ID_PARAMS_PARAM_KEY_VALUES |
METABASE_POST_API_DASHBOARD_SAVE_COLLECTION_PARENT_COLLECTION_ID | METABASE_POST_API_DASH_SAVE_COLLECTION_PARENT_COLLECTION_ID |
METABASE_POST_API_EE_METABOT_TOOLS_CREATE_DASHBOARD_SUBSCRIPTION | METABASE_POST_API_EE_METABOT_TOOLS_CREATE_DASH_SUB |
METABASE_POST_API_EE_METABOT_TOOLS_GET_DASHBOARD_DETAILS | METABASE_POST_API_EE_METABOT_TOOLS_GET_DASH_DETAILS |
METABASE_POST_API_EE_METABOT_TOOLS_GET_DOCUMENT_DETAILS | METABASE_POST_API_EE_METABOT_TOOLS_GET_DOC_DETAILS |
SALESFORCE_GET_VALUES_FOR_ALL_PICKLIST_FIELDS_OF_A_RECORD_TYPE | SALESFORCE_GET_PICKLIST_VALUES_BY_RECORD_TYPE |
SALESFORCE_GET_UIAPI_LIST_INFO_ACCOUNT_RECENT_LISTS_ONLY_TRUE | SALESFORCE_GET_UI_API_LIST_INFO_RECENT |
SALESFORCE_GET_UIAPI_RELATED_LIST_PREFERENCES_BATCH_ACCOUNTRELATEDCONTACTLISTACCOUNTRELATEDOPPORTUNITYLIST | SALESFORCE_GET_RELATED_LIST_PREFS_BATCH |
SALESFORCE_SERVICE_CLOUD_VISITOR_SENSITIVE_DATA_RULE_TRIGGERED | SALESFORCE_SERVICE_CLOUD_VISITOR_SENSITIVE_DATA_RULE |
SAP_SUCCESSFACTORS_CREATE_OR_UPDATE_A_SUCCESSOR_NOMINATION_FOR_A_POSITION_OR_TALENT_POOL | SAP_SUCCESSFACTORS_CREATE_UPDATE_SUCCESSOR_NOMINATION |
SAP_SUCCESSFACTORS_DELETE_A_NOMINATION_FOR_A_POSITION_OR_TALENT_POOL | SAP_SUCCESSFACTORS_DELETE_NOMINATION_POSITION_TALENT_POOL |
SAP_SUCCESSFACTORS_GET_FEEDBACK_RECORDS_SERVICE_AVAILABLE_VIA_SAP_BUSINESS_ACCELERATOR_HUB | SAP_SUCCESSFACTORS_GET_FEEDBACK_RECORDS_SERVICE_AVAILABLE |
SAP_SUCCESSFACTORS_GET_ODATA_METADATA_FOR_CALIBRATION_SESSION_SERVICE | SAP_SUCCESSFACTORS_GET_ODATA_METADATA_CALIB_SESSION_SERVICE |
SAP_SUCCESSFACTORS_GET_ODATA_METADATA_FOR_CLOCK_INCLOCK_OUT_INTEGRATION_SERVICE | SAP_SUCCESSFACTORS_GET_ODATA_METADATA_CLOCK_INCLOCK_OUT |
SAP_SUCCESSFACTORS_GET_ODATA_METADATA_FOR_ONBOARDING_ADDITIONAL_SERVICES | SAP_SUCCESSFACTORS_GET_ODATA_METADATA_ONBOARDING_ADDL |
SAP_SUCCESSFACTORS_GET_PENDING_FEEDBACK_REQUESTS_OR_FEEDBACK_REQUEST_RECORDS | SAP_SUCCESSFACTORS_GET_PENDING_FEEDBACK_REQUESTS_FEEDBACK |
SAP_SUCCESSFACTORS_QUERY_A_CLOCK_IN_CLOCK_OUT_GROUP_BY_CODE_WITH_TIME_EVENT_TYPES | SAP_SUCCESSFACTORS_QUERY_CLOCK_CLOCK_OUT_GROUP_CODE_TIME |
SAP_SUCCESSFACTORS_QUERY_ALL_AVAILABLE_CLOCK_IN_CLOCK_OUT_GROUPS | SAP_SUCCESSFACTORS_QUERY_ALL_AVAILABLE_CLOCK_CLOCK_OUT |
SAP_SUCCESSFACTORS_REFRESH_METADATA_FOR_CONTINUOUS_FEEDBACK_SERVICE | SAP_SUCCESSFACTORS_REFRESH_METADATA_CONT_FEEDBACK_SERVICE |
SAP_SUCCESSFACTORS_UPDATE_THE_INTERNAL_USERNAME_OF_NEW_HIRES_AFTER_HIRING_PROCESS_IS_COMPLETED_FROM_ACTIVE_DIRECTORY | SAP_SUCCESSFACTORS_UPDATE_INTERNAL_USERNAME_NEW_HIRES_AFTER |
SENTRY_RETRIEVE_CUSTOM_INTEGRATION_ISSUE_LINKS_FOR_THE_GIVEN_SENTRY_ISSUE | SENTRY_RETRIEVE_CUSTOM_INTEG_ISSUE_LINKS_GIVEN_SENTRY_ISSUE |
SENTRY_RETRIEVE_THE_CUSTOM_INTEGRATIONS_CREATED_BY_AN_ORGANIZATION | SENTRY_RETRIEVE_THE_CUSTOM_INTEGS_CREATED_BY_AN_ORG |
SHOPIFY_ADJUSTS_THE_INVENTORY_LEVEL_OF_AN_INVENTORY_ITEM_AT_A_LOCATION | SHOPIFY_ADJUSTS_INVENTORY_LEVEL_INVENTORY_ITEM_AT_LOCATION |
SHOPIFY_CREATE_PRICE_RULES_PARAM_PRICE_RULE_ID_DISCOUNT_CODES | SHOPIFY_CREATE_PRICE_RULES_PARAM_PRICE_RULE_ID_DISCOUNT |
SHOPIFY_DELETE_FULFILLMENT_SERVICES_PARAM_FULFILLMENT_SERVICE_ID | SHOPIFY_DELETE_FULFILLMENT_SERVICES_PARAM_FULFILLMENT |
SHOPIFY_GET_COUNTRIES_PARAM_COUNTRY_ID_PROVINCES_PARAM_PROVINCE_ID | SHOPIFY_GET_COUNTRIES_PARAM_COUNTRY_ID_PROVINCES_PARAM |
SHOPIFY_GET_FULFILLMENT_ORDERS_PARAM_FULFILLMENT_ORDER_ID_LOCATIONS_FOR_MOVE | SHOPIFY_GET_FULFILLMENT_ORDERS_PARAM_FULFILLMENT_ORDER_ID |
SHOPIFY_GET_PRICE_RULES_PARAM_PRICE_RULE_ID_BATCH_PARAM_BATCH_ID | SHOPIFY_GET_PRICE_RULES_PARAM_PRICE_RULE_ID_BATCH_PARAM |
SHOPIFY_PERFORMS_BULK_OPERATIONS_FOR_MULTIPLE_CUSTOMER_ADDRESSES | SHOPIFY_PERFORMS_BULK_OPERATIONS_MULTIPLE_CUSTOMER_ADDRESSES |
SHOPIFY_RETRIEVE_A_LIST_OF_METAFIELDS_FROM_THE_RESOURCE_S_ENDPOINT | SHOPIFY_RETRIEVE_LIST_METAFIELDS_RESOURCE_S_ENDPOINT |
SHOPIFY_RETRIEVE_A_LIST_OF_PRODUCTS_BELONGING_TO_A_COLLECTION | SHOPIFY_RETRIEVE_LIST_PRODUCTS_BELONGING_COLLECTION |
SHOPIFY_RETRIEVES_A_LIST_OF_ALL_ARTICLE_TAGS_FROM_A_SPECIFIC_BLOG | SHOPIFY_RETRIEVES_LIST_ALL_ARTICLE_TAGS_SPECIFIC_BLOG |
SHOPIFY_RETRIEVES_A_LIST_OF_DISCOUNT_CODES_FOR_A_DISCOUNT_CODE_CREATION_JOB | SHOPIFY_RETRIEVES_LIST_DISCOUNT_CODES_DISCOUNT_CODE |
SHOPIFY_RETRIEVES_A_LIST_OF_STOREFRONT_ACCESS_TOKENS_THAT_HAVE_BEEN_ISSUED | SHOPIFY_RETRIEVES_LIST_STOREFRONT_ACCESS_TOKENS_THAT_HAVE |
SHOPIFY_RETRIEVES_FULFILLMENTS_ASSOCIATED_WITH_A_FULFILLMENT_ORDER | SHOPIFY_RETRIEVES_FULFILLMENTS_ASSOCIATED_FULFILLMENT_ORDER |
SHOPIFY_SETS_THE_INVENTORY_LEVEL_FOR_AN_INVENTORY_ITEM_AT_A_LOCATION | SHOPIFY_SETS_INVENTORY_LEVEL_INVENTORY_ITEM_AT_LOCATION |
SHOPIFY_SHOP_RETRIEVE_A_LIST_OF_METAFIELDS_FROM_THE_RESOURCE_S_ENDPOINT | SHOPIFY_SHOP_RETRIEVE_LIST_METAFIELDS_RESOURCE_S_ENDPOINT |
SHOPIFY_UPDATE_COUNTRIES_PARAM_COUNTRY_ID_PROVINCES_PARAM_PROVINCE_ID | SHOPIFY_UPDATE_COUNTRIES_PARAM_COUNTRY_ID_PROVINCES_PARAM |
STRIPE_DELETE_CUSTOMERS_CUSTOMER_SUBSCRIPTIONS_SUBSCRIPTION_EXPOSED_ID | STRIPE_DELETE_CUSTOMER_SUB_EXPOSED_ID |
STRIPE_DELETE_CUSTOMERS_CUSTOMER_SUBSCRIPTIONS_SUBSCRIPTION_EXPOSED_ID_DISCOUNT | STRIPE_DELETE_CUSTOMER_SUB_EXPOSED_ID_DISCOUNT |
STRIPE_GET_CUSTOMERS_CUSTOMER_BALANCE_TRANSACTIONS_TRANSACTION | STRIPE_GET_CUSTOMERS_CUSTOMER_BALANCE_TXNS_TXN |
STRIPE_GET_CUSTOMERS_CUSTOMER_SUBSCRIPTIONS_SUBSCRIPTION_EXPOSED_ID | STRIPE_GET_CUSTOMERS_CUSTOMER_SUBS_SUB_EXPOSED_ID |
STRIPE_GET_CUSTOMERS_CUSTOMER_SUBSCRIPTIONS_SUBSCRIPTION_EXPOSED_ID_DISCOUNT | STRIPE_GET_CUSTOMERS_CUSTOMER_SUBS_SUB_EXPOSED_ID_DISCOUNT |
STRIPE_GET_V1_ACCOUNTS_CAPABILITIES_CAPABILITIES_ACCOUNTS_CAPABILITIES | STRIPE_GET_V1_ACCOUNTS_CAPABILITIES_CAPABILITIES_ACCOUNTS |
STRIPE_GET_V1_BILLING_CREDIT_BALANCE_TRANSACTIONS_OVERVIEW_BILLING_CREDIT_BALANCE_TRANSACTIONS | STRIPE_GET_V1_BILLING_CREDIT_BALANCE_TXNS_OVERVIEW_BILLING |
STRIPE_GET_V1_BILLING_PORTAL_CONFIGURATIONS_OVERVIEW_BILLING_PORTAL_CONFIGURATIONS | STRIPE_GET_V1_BILLING_PORTAL_CONFIGS_OVERVIEW_BILLING |
STRIPE_GET_V1_ENTITLEMENTS_ACTIVE_ENTITLEMENTS_ACTIVE_ENTITLEMENT | STRIPE_GET_V1_ENTITLEMENTS_ACTIVE_ENTITLEMENTS_ACTIVE |
STRIPE_GET_V1_FINANCIAL_CONNECTIONS_ACCOUNTS_OVERVIEW_FINANCIAL_CONNECTIONS_ACCOUNTS | STRIPE_GET_V1_FIN_CONNS_ACCOUNTS_OVERVIEW_FIN_CONNS_ACCOUNTS |
STRIPE_GET_V1_PAYMENT_METHOD_CONFIGURATIONS_LIST_PAYMENT_METHOD | STRIPE_GET_V1_PAYMENT_METHOD_CONFIGS_LIST_PAYMENT_METHOD |
STRIPE_GET_V1_PAYMENT_METHOD_CONFIGURATIONS_LIST_PAYMENT_METHOD2 | STRIPE_GET_V1_PAYMENT_METHOD_CONFIGS_LIST_PAYMENT_METHOD2 |
STRIPE_GET_V1_QUOTES_COMPUTED_UPFRONT_LINE_ITEMS_LIST_ALL_QUOTES | STRIPE_GET_V1_QUOTES_COMPUTED_UPFRONT_LINE_ITEMS_LIST_ALL |
STRIPE_GET_V1_REPORTING_REPORT_TYPES_OVERVIEW_REPORTING_REPORT_TYPES | STRIPE_GET_V1_REPORTING_REPORT_TYPES_OVERVIEW_REPORTING |
STRIPE_GET_V1_TEST_HELPERS_TEST_CLOCKS_DELETE_A_TEST_TEST_HELPERS_TEST_CLOCKS | STRIPE_GET_V1_TEST_HELPERS_TEST_CLOCKS_DELETE_TEST_TEST |
STRIPE_POST_CUSTOMERS_CUSTOMER_SUBSCRIPTIONS_SUBSCRIPTION_EXPOSED_ID | STRIPE_POST_CUSTOMERS_CUSTOMER_SUBS_SUB_EXPOSED_ID |
STRIPE_POST_PAYMENT_RECORDS_ID_REPORT_PAYMENT_ATTEMPT_CANCELED | STRIPE_POST_PAYMENT_RECORDS_REPORT_ATTEMPT_CANCELED |
STRIPE_POST_PAYMENT_RECORDS_ID_REPORT_PAYMENT_ATTEMPT_INFORMATIONAL | STRIPE_POST_PAYMENT_RECORDS_REPORT_ATTEMPT_INFO |
STRIPE_POST_TAX_TRANSACTIONS_CREATE_FROM_CALCULATION_OVERVIEW | STRIPE_POST_TAX_TXNS_CREATE_FROM_CALCULATION_OVERVIEW |
STRIPE_POST_TERMINAL_READERS_CANCEL_ACTION_SET_READER_DISPLAY | STRIPE_POST_TERMINAL_READERS_CANCEL_ACTION_SET_READER |
STRIPE_POST_TERMINAL_READERS_COLLECT_INPUTS_SET_READER_DISPLAY | STRIPE_POST_TERMINAL_READERS_COLLECT_INPUTS_SET_READER |
STRIPE_POST_TERMINAL_READERS_CONFIRM_PAYMENT_INTENT_SET_READER_DISPLAY | STRIPE_POST_TERMINAL_READERS_CONFIRM_PAYMENT_INTENT_SET |
STRIPE_POST_TEST_HELPERS_CUSTOMERS_FUND_CASH_BALANCE_FUND_A_TEST | STRIPE_POST_TEST_HELPERS_CUSTOMERS_FUND_CASH_BALANCE_FUND |
STRIPE_POST_TEST_HELPERS_TERMINAL_READERS_READER_PRESENT_PAYMENT_METHOD | STRIPE_POST_TEST_HELPERS_TERMINAL_READERS_READER_PRESENT |
STRIPE_POST_TEST_HELPERS_TERMINAL_READERS_READER_SUCCEED_INPUT_COLLECTION | STRIPE_POST_TEST_HELPERS_TERMINAL_READERS_READER_SUCCEED |
STRIPE_POST_TEST_HELPERS_TERMINAL_READERS_READER_TIMEOUT_INPUT_COLLECTION | STRIPE_POST_TEST_HELPERS_TERMINAL_READERS_READER_TIMEOUT |
STRIPE_POST_V1_BILLING_PORTAL_CONFIGURATIONS_OVERVIEW_BILLING_PORTAL_CONFIGURATIONS | STRIPE_POST_V1_BILLING_PORTAL_CONFIGS_OVERVIEW_BILLING |
STRIPE_POST_V1_PAYMENT_METHOD_CONFIGURATIONS_LIST_PAYMENT_METHOD2 | STRIPE_POST_V1_PAYMENT_METHOD_CONFIGS_LIST_PAYMENT_METHOD2 |
STRIPE_POST_V1_PAYMENT_METHOD_DOMAINS_PAYMENT_METHOD_DOMAINS2 | STRIPE_POST_V1_PAYMENT_METHOD_DOMAINS_PAYMENT_METHOD |
STRIPE_POST_V1_PAYMENT_RECORDS_REPORT_PAYMENT_ATTEMPT_CANCELED_OVERVIEW | STRIPE_POST_V1_PAYMENT_RECORDS_REPORT_CANCELED |
STRIPE_POST_V1_PAYMENT_RECORDS_REPORT_PAYMENT_ATTEMPT_GUARANTEED_OVERVIEW | STRIPE_POST_V1_PAYMENT_RECORDS_REPORT_GUARANTEED |
STRIPE_POST_V1_PAYMENT_RECORDS_REPORT_PAYMENT_ATTEMPT_INFORMATIONAL_OVERVIEW | STRIPE_POST_V1_PAYMENT_RECORDS_REPORT_INFO |
STRIPE_POST_V1_PAYMENT_RECORDS_REPORT_PAYMENT_ATTEMPT_OVERVIEW | STRIPE_POST_V1_PAYMENT_RECORDS_REPORT_ATTEMPT |
STRIPE_POST_V1_TEST_HELPERS_CONFIRMATION_TOKENS_CREATE_A_TEST | STRIPE_POST_V1_TEST_HELPERS_CONFIRMATION_TOKENS_CREATE_TEST |
STRIPE_POST_V2_BILLING_METER_EVENT_ADJUSTMENTS_METER_EVENT_ADJUSTMENTS | STRIPE_POST_V2_BILLING_METER_EVENT_ADJUSTMENTS_METER_EVENT |
Migration
If you're referencing any affected tool enums by their old names, update to the new shortened names.
Optional API Key Enforcement for MCP Servers
We've introduced a new project-level security setting that allows you to require API key authentication for all MCP server requests. This opt-in feature gives you fine-grained control over who can access your MCP endpoints.
Opt-in today, default soon: This feature is currently opt-in. Starting March 1, 2026, it will be enabled by default for new organizations. We recommend enabling it now to prepare your integrations.
What's New
A new "Require API Key for MCP" toggle is now available in your Project Settings. When enabled, all requests to your MCP servers must include a valid Composio API key in the request headers.
| Setting | Default | Impact |
|---|---|---|
require_mcp_api_key | false | Opt-in; no changes to existing behavior |
How It Works
When the setting is disabled (default):
- MCP servers work without API key authentication
- Existing integrations continue to function unchanged
When the setting is enabled:
- All MCP requests must include the
x-api-keyheader with a valid Composio API key - Requests without a valid API key receive
401 Unauthorized - Only API keys belonging to the same project are accepted
Request Examples
Without API key (when enforcement is enabled):
curl -X POST "https://mcp.composio.dev/{your_mcp_server_url}" \
  -H "Content-Type: application/json" \
  -d '{"jsonrpc":"2.0","id":1,"method":"initialize"}'

# Response: 401 Unauthorized
With API key:
curl -X POST "https://mcp.composio.dev/{your_mcp_server_url}" \
  -H "Content-Type: application/json" \
  -H "x-api-key: ak_your_api_key" \
  -d '{"jsonrpc":"2.0","id":1,"method":"initialize"}'

# Response: 200 OK
Enabling the Setting
Via Dashboard
- Navigate to Project Settings
- Go to the Project Configuration tab
- Find the "Require API Key for MCP" toggle
- Enable the toggle
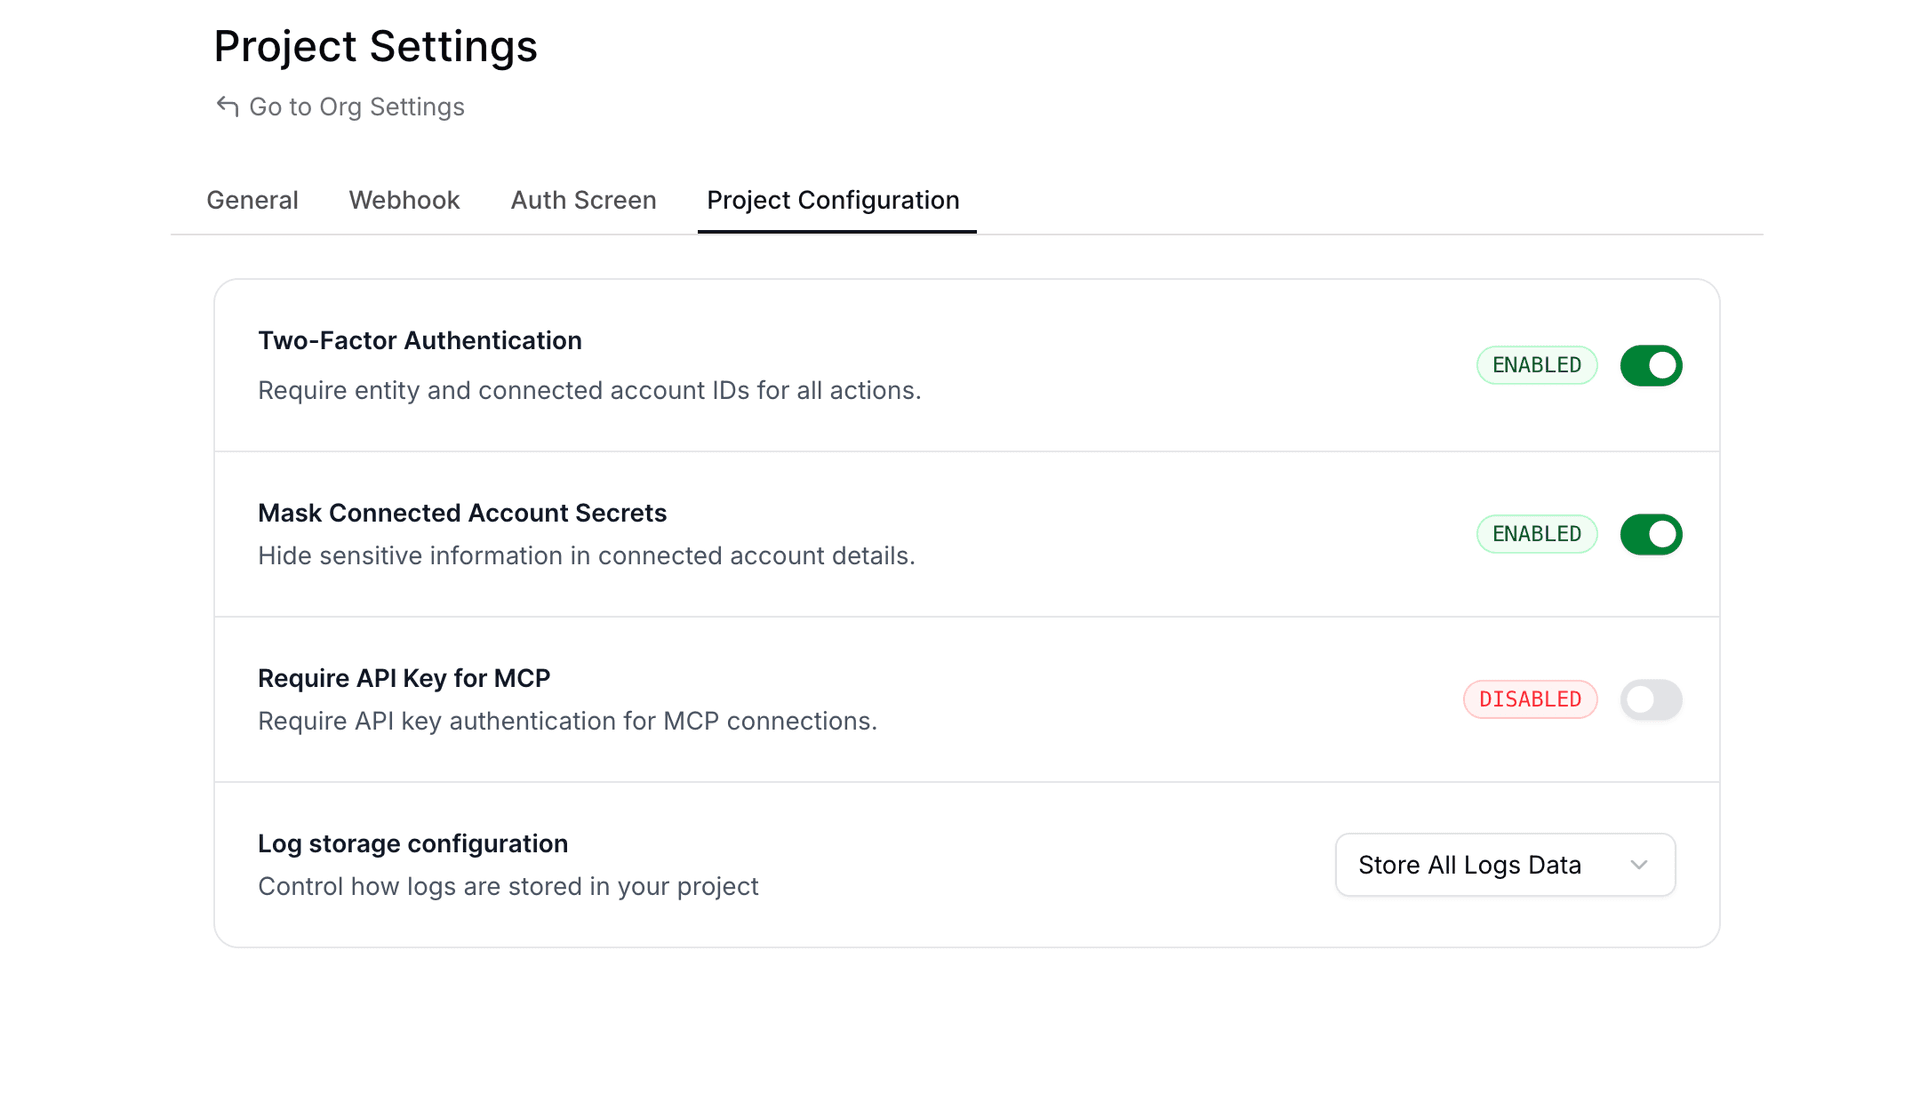
Via API
Update your project configuration using the API:
curl -X PATCH "https://backend.composio.dev/api/v3/org/project/config" \
  -H "Content-Type: application/json" \
  -H "x-api-key: ak_your_api_key" \
  -d '{"require_mcp_api_key": true}'
Response:
{
  "require_mcp_api_key": true,
  "is_2FA_enabled": true,
  "mask_secret_keys_in_connected_account": true,
  "log_visibility_setting": "show_all"
}
Via Code
import requests

response = requests.patch(
    "https://backend.composio.dev/api/v3/org/project/config",
    headers={
        "Content-Type": "application/json",
        "x-api-key": "ak_your_api_key"
    },
    json={"require_mcp_api_key": True}
)

print(response.json())
When to Use This
Enable API key enforcement when you need to:
- Prevent unauthorized access to your MCP servers
- Control which applications can interact with your MCP endpoints
- Add an extra security layer for production deployments
- Audit and track MCP server usage through API key attribution
API Reference
Get Current Setting
GET /api/v3/org/project/configUpdate Setting
PATCH /api/v3/org/project/config{
"require_mcp_api_key": true
}Consistent Error Response Structure
Tool execution errors now return a standardized response format across all failure types. Previously, the data field was empty on errors—now it always includes status_code and message, matching the structure of successful responses.
What Changed
All error responses from tool execution now include:
data.status_code: HTTP status code (ornullfor non-HTTP errors)data.message: Detailed error messageerror: Same detailed message at the top level
Before vs After
Previous error response:
{
  "data": {},
  "successfull": false,
  "error": "404 Client Error: Not Found for url: ...",
}
New error response:
{
  "data": {
      "http_error": "404 Client Error: Not Found for url: ...",
      "status_code": 404,
      "message": "Resource not found: The requested item does not exist"
  },
  "successfull": false,
  "error": "Resource not found: The requested item does not exist",
}
Why This Matters
- Easier parsing: Agents and code can reliably access error details from
data.messagewithout special-casing emptydataobjects - Better debugging: Detailed error messages replace generic HTTP error strings
- Consistent schema: Same response shape whether the tool succeeds or fails
Union Types Preserved in Tool Schemas
Tool schemas now use standard JSON Schema anyOf for union types, providing accurate type information for LLMs and code generators.
What Changed
Two changes affect how types appear in request/response schemas:
| Change | Scope | Description |
|---|---|---|
| Nullable fields | All toolkits | Fields that accept null now use anyOf: [{type}, {type: "null"}] instead of type + nullable: true |
| Multi-type fields | 157 toolkits | Fields accepting multiple value types (e.g., string | number) preserve the full anyOf array instead of flattening to the first type |
Before vs After
For example, the GOOGLECALENDAR_GET_CURRENT_DATE_TIME request schema changes:
Previous (only a single type):
{
  "timezone": {
    "default": 0,
    "description": "Timezone specification...",
    "title": "Timezone",
    "type": "string"
  }
}
Now (Union types preserved):
{
  "timezone": {
    "anyOf": [
      { "type": "string" },
      { "type": "number" }
    ],
    "default": 0,
    "description": "Timezone specification...",
    "title": "Timezone"
  }
}
Similarly, nullable fields like page_token in GOOGLECALENDAR_LIST_CALENDARS:
Previous:
{
  "page_token": {
    "default": null,
    "description": "Token for the page of results to return...",
    "nullable": true,
    "title": "Page Token",
    "type": "string"
  }
}
Now:
{
  "page_token": {
    "anyOf": [
      { "type": "string" },
      { "type": "null" }
    ],
    "default": null,
    "description": "Token for the page of results to return...",
    "title": "Page Token"
  }
}
Why This Matters
- Accurate schemas: LLMs and code generators see the full set of allowed types
- Better validation: Input validation can now correctly accept all valid types, not just the first one
Deprecating BEARER_TOKEN auth scheme for 19 toolkits
We've deprecated the BEARER_TOKEN auth scheme for the following 19 toolkits:
AirtableDiscordDiscordbotGmailGoogle ClassroomGoogle Search ConsoleGoogle CalendarGoogle DocsGoogle DriveGoogle SlidesGoogle SuperInstagramNtfySapling AISlackSlackbotTawk ToTikTokTwitter
Recommendation
For these toolkits, we recommend using alternative auth schemes (for example, OAUTH2, API_KEY, or other toolkit-supported schemes) instead of BEARER_TOKEN.
Backward compatibility (explicit)
This change is fully backward compatible:
- Existing auth configs and connected accounts created with
BEARER_TOKENwill continue to function. - Creating new auth configs and connected accounts with
BEARER_TOKENwill continue to work (e.g., via API/SDK). - To discourage new usage,
BEARER_TOKENauth configs / connected accounts will not be displayed in the UI for these toolkits.
Binary Data Support for Proxy Execute
The /api/v3/tools/execute/proxy endpoint now supports binary data for both file uploads and downloads.
File Uploads (binary_body)
To upload a file via the proxy, use the binary_body field in your request payload. This supports two approaches: specifying either a URL pointing to the file or providing the base64-encoded content directly.
Upload File via URL
curl --location 'https://backend.composio.dev/api/v3/tools/execute/proxy' \
  --header 'accept: application/json' \
  --header 'x-api-key: <YOUR_API_KEY>' \
  --header 'Content-Type: application/json' \
  --data '{
    "endpoint": "/upload-endpoint",
    "method": "POST",
    "connected_account_id": "<CONNECTED_ACCOUNT_ID>",
    "binary_body": {
      "url": "{URL_TO_THE_FILE}"
    }
  }'
Upload File via Base64 Content
Supported up to 4MB file size.
curl --location 'https://backend.composio.dev/api/v3/tools/execute/proxy' \
  --header 'accept: application/json' \
  --header 'x-api-key: <YOUR_API_KEY>' \
  --header 'Content-Type: application/json' \
  --data '{
    "endpoint": "/upload-endpoint",
    "method": "POST",
    "connected_account_id": "<CONNECTED_ACCOUNT_ID>",
    "binary_body": {
      "base64": "JVBERi0xLjQKJ...<base64_data>...",
      "content_type": "application/pdf"
    }
  }'
File Downloads (binary_data)
When the proxied request returns a binary response (for example, a PDF or image), the proxy automatically uploads the file to temporary storage, and you receive a signed URL in the binary_data field. This enables you to download large files securely.
File Download Request
curl --location 'https://backend.composio.dev/api/v3/tools/execute/proxy' \
  --header 'accept: application/json' \
  --header 'x-api-key: <YOUR_API_KEY>' \
  --header 'Content-Type: application/json' \
  --data '{
    "endpoint": "{YOUR_ENDPOINT}",
    "method": "GET",
    "connected_account_id": "{YOUR_CONNECTED_ACCOUNT_ID}"
  }'
File Download Response
{
  "data": {},
  "binary_data": {
    "url": "url to the file",
    "content_type": "content type of the file",
    "size": "size of the file",
    "expires_at": "expires at of the file"
  },
  "status": "status code of the response",
  "headers": "headers of the response"
}
Summary
| Feature | Field | Description |
|---|---|---|
| File Upload via URL | binary_body.url | Provide a URL pointing to the file to upload |
| File Upload via Base64 | binary_body.base64 + binary_body.content_type | Provide base64-encoded content (up to 4MB) |
| File Download | binary_data in response | Receive a signed URL to download binary responses |
We'd love your feedback on the new proxy execute capabilities. If anything feels unclear or you have suggestions for improvement, please reach out.
Webhook Payload V3 - Lookahead Announcement
We're introducing Webhook Payload V3 - a redesigned webhook structure that follows industry standards and provides better developer experience. This update affects how you receive trigger events via webhooks and Pusher.
What's Changing?
New Webhook Structure
We're adopting the Standard Webhooks specification for better consistency and reliability.
Headers
A new header will identify the webhook version:
x-composio-webhook-version: V3Payload Structure
The payload structure is being reorganized to separate Composio metadata from trigger data:
Before (V2):
{
  "log_id": "log_TpxVOLXYnwXZ",
  "timestamp": "2025-12-23T13:06:07.695Z",
  "type": "gmail_new_gmail_message",
  "data": {
    "connection_id": "a1b2c3d4-5e6f-7a8b-9c0d-1e2f3a4b5c6d",
    "connection_nano_id": "ca_xYz9AbCdEfGh",
    "trigger_nano_id": "ti_JZFoTyYKbzhB",
    "trigger_id": "7f8e9d0c-1b2a-3c4d-5e6f-7a8b9c0d1e2f",
    "user_id": "usr-demo-12a3b4c5...",
    // ... actual trigger data mixed with metadata
  }
}
After (V3):
{
  "id": "msg_a1b2c3d4-5e6f-7a8b-9c0d-1e2f3a4b5c6d",
  "timestamp": "2025-12-23T13:06:07.695Z",
  "type": "composio.trigger.message",
  "metadata": {
    "log_id": "log_TpxVOLXYnwXZ",
    "trigger_slug": "GMAIL_NEW_GMAIL_MESSAGE",
    "auth_config_id": "ac_aCYTppZ5RsRc",
    "connected_account_id": "ca_cATYssZ5RrSc",
    "trigger_id": "ti_JZFoTyYKbzhB",
    "user_id": "pg-test-86c9fc84..."
  },
  "data": {
    // Clean trigger data without Composio metadata
  }
}
Key Improvements
- Metadata Separation: Composio-specific fields (connection IDs, trigger IDs, user IDs) are now in a dedicated
metadataobject - Clean Data: The
datafield now contains only the actual trigger payload without infrastructure metadata - Standardized Type Field: The
typefield now follows a consistent format (composio.trigger.message) instead of trigger-specific names likegmail_new_gmail_message - Trigger Slug in Metadata: The trigger slug (e.g.,
GMAIL_NEW_GMAIL_MESSAGE) is now available inmetadata.trigger_slugfor easy identification - Standards Compliance: Follows Standard Webhooks specification for better interoperability
- Consistent Structure: Same payload structure for both webhooks and Pusher channels
Migration Guide
Updating Your Webhook Handlers
If you're accessing Composio metadata fields, update your code:
# Before (V2)
trigger_type = payload["type"]  # "gmail_new_gmail_message"
connection_id = payload["data"]["connection_id"]
trigger_id = payload["data"]["trigger_id"]
message_text = payload["data"]["message_text"]

# After (V3)
trigger_type = payload["type"]  # "composio.trigger.message"
trigger_slug = payload["metadata"]["trigger_slug"]  # "GMAIL_NEW_GMAIL_MESSAGE"
connection_id = payload["metadata"]["connected_account_id"]
trigger_id = payload["metadata"]["trigger_id"]
message_text = payload["data"]["message_text"]
// Before (V2)
const triggerSlug = payload.type; // "gmail_new_gmail_message"
const connectionId = payload.data.connection_id;
const triggerId = payload.data.trigger_id;
const messageText = payload.data.message_text;
// After (V3)
const webhookType = payload.type; // "composio.trigger.message"
const triggerSlug = payload.metadata.trigger_slug; // "GMAIL_NEW_GMAIL_MESSAGE"
const connectionId = payload.metadata.connected_account_id;
const triggerId = payload.metadata.trigger_id;
const messageText = payload.data.message_text;Checking Webhook Version
You can detect the webhook version from headers:
webhook_version = headers.get("x-composio-webhook-version", "V2")
if webhook_version == "V3":
    # Use new structure
    metadata = payload["metadata"]
else:
    # Use old structure
    metadata = payload["data"]
Rollout Timeline
- December 2025: V3 released, opt-in via project settings
- February 15, 2026: All new organizations will default to V3
- Existing organizations: Continue using V2 by default, can opt-in to V3 anytime
How to Opt-In
- Go to your project settings in the Composio dashboard
- Navigate to the Webhooks section
- Select "Webhook Payload Version: V3"
- Update your webhook handlers to use the new structure
- Test thoroughly before enabling in production
Organizations created before February 15, 2026 will remain on V2 by default. You can switch to V3 at your convenience.
Organizations created on or after February 15, 2026 will use V3 by default.
Benefits
- Better DX: Clear separation between metadata and actual trigger data
- Standards Compliance: Follows industry-standard webhook specifications
- Consistency: Same structure across webhooks and Pusher channels
- Future-Proof: Built on established standards for long-term compatibility
Need Help?
If you have questions about migrating to V3 or need assistance:
- Join our Discord community
- Check our documentation
- Contact support at support@composio.dev
Authentication & Configuration Updates Across Multiple Toolkits
Summary
This release includes significant authentication and configuration improvements across 16+ toolkits. The changes standardize Base URL handling, modernize authentication methods, and fix various endpoint configurations to improve reliability and flexibility.
| Toolkit | Change Type | Description |
|---|---|---|
| Make | Breaking | Removed Region field, replaced with Base URL |
| Linear | Improvement | Base URL is no longer configurable |
| Kibana | Improvement | Removed default value for Base URL |
| Insightly | Fix | Added default value for Pod field |
| HelloBar | Deprecated | Deprecated bearer authentication |
| Gong | Fix | Added default value for Base URL |
| FormSite | Deprecated | Deprecated bearer auth, added API key authentication |
| DataScope | Fix | Fixed Get Current User Endpoint |
| D2L Brightspace | Fix | Updated Get Current User Endpoint |
| ClickUp | Fix | Changed Base URL field type |
| Bubble | Breaking | Fixed Base URL field, removed Subdomain |
| Brilliant Directories | Fix | Implemented dynamic Base URL for user endpoint |
| Braintree | Improvement | Updated to production defaults with dynamic endpoints |
| Auth0 | Improvement | Replaced hardcoded endpoint with dynamic tenant Base URL |
Breaking Changes
We verified that active usage for these toolkits is practically zero before proceeding with these changes.
Make Toolkit
- Removed Region field in favor of explicit Base URL configuration
- Users must now provide the full Base URL instead of selecting a region
- This change provides more flexibility for custom deployments and regional endpoints
Bubble Toolkit
- Removed Subdomain field and restructured Base URL handling
- Users must now provide the complete Base URL instead of just the Subdomain
- This change standardizes URL configuration across all toolkits
Deprecated Features
HelloBar Toolkit
- Bearer authentication is now deprecated
- While still functional, users are encouraged to migrate to newer authentication methods
- Support for bearer tokens will be removed in a future release
FormSite Toolkit
- Bearer authentication deprecated in favor of API key authentication
- New integrations should use API key authentication for improved security
- Existing bearer token implementations will continue to work but should be migrated
Improvements & Fixes
Configuration Improvements
Linear Toolkit - Base URL is no longer a configurable field. The toolkit now uses a fixed endpoint, simplifying the authentication process.
Kibana Toolkit - Removed the default value for Base URL, allowing for more flexible deployment configurations. Users can now specify custom Kibana instances without overriding defaults.
Gong Toolkit - Added a sensible default value for Base URL to simplify initial setup. New users can connect without manually configuring the endpoint.
Insightly Toolkit - Added default value for the Pod field to streamline configuration. Reduces setup complexity for standard deployments.
ClickUp Toolkit - Fixed the Base URL field type for proper validation and handling. Ensures consistent URL formatting across all operations.
Dynamic Endpoint Updates
Brilliant Directories Toolkit - Implemented dynamic Base URL resolution for the Get Current User Endpoint. Automatically adapts to different deployment environments.
Braintree Toolkit - Updated configuration to use production defaults. Implemented dynamic endpoint resolution for better environment handling. Improved reliability for production deployments.
Auth0 Toolkit - Replaced hardcoded endpoints with dynamic tenant-based URL resolution. Supports multi-tenant deployments without manual configuration. Automatically constructs the correct endpoint based on the tenant configuration.
Endpoint Fixes
DataScope Toolkit - Fixed the Get Current User Endpoint to use the correct API path. Resolves authentication verification issues.
D2L Brightspace Toolkit - Updated the Get Current User Endpoint to match the latest API specifications. Ensures proper user identification and session validation.
Migration Guide
For toolkits with breaking changes, please update your configurations as follows:
- Make: Replace Region with the full Base URL (e.g.,
https://us-east-1.make.com) - Bubble: Replace Subdomain with the full Base URL (e.g.,
https://myapp.bubbleapps.io)
For deprecated authentication methods:
- HelloBar & FormSite: Generate new API keys from your account settings and update your authentication configuration
Authentication Updates Across Multiple Toolkits
We've updated authentication configurations for several toolkits to improve security, fix issues, and support additional deployment options.
Summary
| Toolkit | Change Type | Action Required |
|---|---|---|
| Ashby | Deprecated | No |
| Freshdesk | Deprecated | No |
| Freshservice | Deprecated | No |
| Make | Breaking | New auth config + user reconnect |
| Mixpanel | Fix | No |
| Recall AI | Breaking | New auth config + user reconnect |
| Relevance AI | Breaking | New auth config + user reconnect |
| SmartRecruiters | Breaking | New auth config + user reconnect |
| Supabase | Improvement | No |
| Trello | Deprecated | No |
| ZoomInfo | Deprecated | No |
Breaking Changes
These toolkits had incorrect or outdated authentication configurations that needed fixing. We verified that active usage for these toolkits is practically zero before proceeding with these changes.
Impact: Existing connections will stop working. You'll need to create new auth configs and ask affected users to reconnect.
Make
Replaced region-based configuration with full base URL input. Users now provide the complete Make instance URL (e.g., https://us2.make.com or https://us1.make.celonis.com) instead of just a region code.
Recall AI
Updated from region-based to full base URL configuration. Fixed field descriptions and metadata. Updated categories to AI/Productivity/Communication and added proper documentation links.
Relevance AI
Simplified authentication by removing deprecated Project ID field. Added conditional mapping for region codes to API subdomains (AU→f1db6c, EU→d7b62b, US→bcbe5a). Region field now defaults to US.
SmartRecruiters
Fixed OAuth configuration with correct SmartRecruiters endpoints. Added proper default scopes for candidates, jobs, and users. Enabled PKCE and added refresh token support.
Deprecated (Still Working)
These changes introduce new auth methods while keeping old ones functional:
Ashby
Added new API Key authentication scheme with automatic base64 encoding and proper authorization headers.
No Action Required: Old Basic Auth method is deprecated but continues to work. Existing connections are unaffected.
Freshdesk
Added new API Key authentication scheme requiring subdomain and API key with automatic base64 encoding.
No Action Required: Old Basic Auth method is deprecated but continues to work. Existing connections are unaffected.
Freshservice
Added new API Key authentication scheme requiring subdomain and API key with automatic base64 encoding.
No Action Required: Old Basic Auth method is deprecated but continues to work. Existing connections are unaffected.
Trello
Marked Bearer Token authentication as deprecated in favor of OAuth authentication.
No Action Required: Old Bearer auth continues to function. OAuth is recommended for new connections.
ZoomInfo
Added new OAuth2 authentication scheme with comprehensive scopes for contacts, companies, audiences, scoops, news, and intent data. Deprecated the old JWT-based Basic authentication. Password field now properly marked as secret.
No Action Required: Old JWT auth continues to function. New connections will use OAuth2.
Non-Breaking Improvements
Mixpanel
Fixed region mapping logic for data residency. Added proper conditional evaluation to map regions to correct API hosts (EU, India, or Standard). Region field is now optional and defaults to Standard server. Service account secret now properly marked as secret.
No Action Required: Existing connections continue to work without changes.
Supabase
Changed base_url field type from auth_config_field to connection_field for both OAuth and API Key schemes. Updated base action logic to respect user-provided base URLs, enabling support for self-hosted Supabase instances.
No Action Required: Existing connections continue to work. Self-hosted instances now supported.
Toolkit Deprecation: Removing Empty Toolkits
What's Changed
We're deprecating 15 toolkits that currently have no supported actions. These toolkits will be reactivated once we add functional actions to them, ensuring you only see integrations that are ready to use.
Deprecated Toolkits
The following toolkits are now deprecated:
BREATHEHR,DIXA,EGNYTE,EXPENSIFY,FREEAGENTGUSTO,NUTSHELL,OPENNUTRITION,OYSTERHR,RAKUTENSALESFLARE,TEAMLEADER,WALGREENS,WHOOP,WIX
Impact on Your Integration
API Behavior Changes
List Toolkits Endpoint
The GET /toolkits endpoint will now exclude deprecated toolkits by default.
Need to see deprecated toolkits? Use the include_deprecated query parameter.
Backward Compatibility
Your existing integrations are safe. All other endpoints continue to work with deprecated toolkits:
- Retrieve the toolkit details
- Create auth configurations
- Manage connected accounts
- Configure MCP Servers
This ensures zero breaking changes to your current implementations.
Why This Matters
This change helps you:
- Focus on working integrations - No clutter from non-functional toolkits
- Avoid integration attempts with toolkits that have no actions
- Better developer experience with a cleaner, more actionable toolkit list
Questions?
If you have questions or need support with any deprecated toolkit, reach out to our team or check our documentation.
Toolkit Deprecation: Streamlining Our Platform
What's Changed
We're deprecating 60 toolkits that currently have no supported actions. These toolkits will be reactivated once we add functional actions to them, ensuring you only see integrations that are ready to use.
Deprecated Toolkits
The following toolkits are now deprecated:
ACCELO,ADOBE,AERO_WORKFLOW,AMAZON,APEX27APPOINTO,APPSFLYER,ATLASSIAN,AUTH0,AXONAUTBATTLENET,BOLDSIGN,BRAINTREE,BREEZY_HR,BREX_STAGINGBRIGHTPEARL,BROWSERHUB,CUSTOMER_IO,DEEL,DRIP_JOBSEPIC_GAMES,FACTORIAL,FITBIT,FRONT,GO_TO_WEBINARGURU,HELCIM,HIGHLEVEL,ICIMS_TALENT_CLOUD,IDEA_SCALEKEAP,LASTPASS,LEVER_SANDBOX,LEXOFFICE,MANY_CHATMBOUM,MICROSOFT_TENANT,MOXIE,ONCEHUB,POPTINPRECORO,PRINTNODE,QUALAROO,RAVENSEOTOOLS,RING_CENTRALRIPPLING,SAGE,SALESFORCE_MARKETING_CLOUD,SEISMIC,SMARTRECRUITERSTAPFORM,TERMINUS,TIMEKIT,TWITCH,VENLYVERO,VISME,WAVE_ACCOUNTING,WIZ,ZOHO_DESK
Impact on Your Integration
API Behavior Changes
List Toolkits Endpoint
The GET /toolkits endpoint will now exclude deprecated toolkits by default.
Need to see deprecated toolkits? Use the new include_deprecated query parameter.
Backward Compatibility
Your existing integrations are safe. All other endpoints continue to work with deprecated toolkits:
- Retrieve the toolkit details
- Create auth configurations
- Manage connected accounts
- Configure MCP Servers
This ensures zero breaking changes to your current implementations.
Why This Matters
This change helps you:
- Focus on working integrations - No clutter from non-functional toolkits
- Avoid integration attempts with toolkits that have no actions
- Better developer experience with a cleaner, more actionable toolkit list
Questions?
If you have questions or need support with any deprecated toolkit, reach out to our team or check our documentation.
Deprecation of is_local_toolkit Field and Removal of is_local Query Parameter
We're cleaning up the Toolkits API by deprecating the is_local_toolkit response field and removing the is_local query parameter filter.
What's Changing?
Response Field: is_local_toolkit (Deprecated)
The is_local_toolkit field in toolkit API responses is now deprecated. This field was originally intended to indicate whether a toolkit was local to a specific project, but it is no longer meaningful as no toolkits use this classification.
Affected Endpoints:
GET /api/v3/toolkits- List toolkitsGET /api/v3/toolkits/{slug}- Get single toolkitGET /api/v3/toolkits/multi- Get multiple toolkits
The field will continue to be returned in API responses for backward compatibility, but it will always return false. It is marked as deprecated: true in the OpenAPI specification.
Query Parameter: is_local (Removed)
The is_local query parameter filter has been removed from the following endpoints:
GET /api/v3/toolkitsGET /api/v3/toolkits/multi
This parameter was used to filter toolkits by their local status, but since no toolkits are classified as local, it served no practical purpose.
Impact on Your Code
If You're Using the is_local Query Parameter
Before:
// This will no longer work
const toolkits = await fetch('/api/v3/toolkits?is_local=true');
After:
// Simply remove the is_local parameter
const toolkits = await fetch('/api/v3/toolkits');
If You're Reading the is_local_toolkit Response Field
The field will continue to be present in responses but will always return false. You can safely ignore this field or remove any logic that depends on it.
Before:
const toolkit = await composio.toolkits.get('github');
if (toolkit.is_local_toolkit) {
  // This condition will never be true
  handleLocalToolkit(toolkit);
}
After:
const toolkit = await composio.toolkits.get('github');
// Remove is_local_toolkit checks - they're no longer meaningfulTool Router General Availability
The Composio SDKs achieved a significant milestone with Tool Router moving from experimental to stable production status in December 2025. The Tool Router is now a fully supported feature that enables creating isolated MCP sessions with scoped toolkit access across both Python 0.10.1 and TypeScript 0.3.0.
Major Achievements
Native Tool Execution: Both SDKs now support direct tool execution through Tool Router sessions. The TypeScript implementation emphasizes improved type safety and error handling, while Python developers benefit from better integration with provider-wrapped tools.
Webhook Security: A new verification method was introduced. The system now provides secure webhook endpoint validation and signature verification for incoming webhooks, enhancing protection for trigger-based workflows.
Framework Compatibility: The stable Tool Router integrates with multiple AI platforms including OpenAI, Anthropic, LangChain, LlamaIndex, CrewAI, and Vercel AI SDK.
Technical Improvements
The TypeScript SDK resolved significant CommonJS compatibility issues by switching bundlers. This addresses a common developer pain point, particularly for Node.js projects not using ES modules.
The Python SDK extended LangChain provider support to version 1, while simultaneously fixing a critical KeyError occurring when SUPABASE_BETA_RUN_SQL_QUERY is used with Agents.
Migration Path
Users upgrading from experimental APIs should note the simplified approach—the Tool Router API now operates directly rather than through experimental namespaces, with comprehensive migration documentation provided.
Removal of label query parameter from connected accounts API
The label query parameter has been removed from the GET /api/v3/connected_accounts endpoint.
What's changing?
The label query parameter is no longer supported when listing connected accounts. This parameter was previously accepted but had no functional behavior since label ingestion was removed in an earlier update.
Impact
None - This is a cleanup change. The label query parameter was not performing any filtering since the underlying label ingestion functionality was already removed. If your code was passing this parameter, it was being silently ignored.
Migration
No action required. If your code was passing the label query parameter, you can safely remove it from your API calls.
Enhanced Security Masking for Sensitive Fields
We've improved the security masking for REDACTED fields in the following APIs:
What's Changed: Sensitive fields are now partially masked, revealing only the first 4 characters to help with debugging while maintaining security.
Example:
Before: REDACTED
After:  abcd...
Disabling Masking
If you need to disable masking for your use case, you have two options:
- Via UI: Navigate to Project Settings → Configuration tab and update the masking settings
- Via API: Use the Patch Project Config API
Typed Responses Across Toolkits
We've updated many toolkits so their outputs are now strongly typed objects instead of a generic response_data blob, meaning tools like Outlook, HubSpot, Notion, etc. now return well-shaped, documented fields you can rely on directly in your code and agents. These improvements apply to the latest toolkit versions—see our toolkit versioning docs for how versions are managed.
Breaking Change for latest Version
If you're using the latest version and your code post-processes the old response_data structure, you'll need to update your code to work with the new flattened, typed response schemas.
Why This Matters
- Better developer experience for direct execute: clear fields and types
- Improved agent performance: flatter output shapes with explicit fields reduce nesting and invalid params
- Clearer docs and type safety: richer metadata for IDEs and autocomplete
Before vs After
Previous (generic, version 20251202_00):
{
  "data": {
    "response_data": { "...": "..." }
  },
  "successful": true
}
Now (typed example – Outlook List Messages, version 20251209_00):
{
  "data": {
    "@odata.context": "https://graph.microsoft.com/v1.0/$metadata#users('me')/messages",
    "@odata.nextLink": "https://graph.microsoft.com/v1.0/me/messages?$skip=10",
    "value": [
      {
        "id": "abc123",
        "subject": "Hi there",
        "from": { "emailAddress": { "address": "a@b.com", "name": "Alice" } },
        "hasAttachments": true
      }
    ]
  },
  "successful": true
}
For the exact field mapping per toolkit, open dashboard.composio.dev → Toolkits → List Messages (or the relevant tool).
Migration Notes
- Breaking change for consumers on the
latestversion who post-process the old nestedresponse_datashape: outputs are now flattened and explicitly typed. - New and modified fields include richer descriptions and examples; some legacy placeholders were removed.
- Re-fetch schemas for your tool/version to see the typed definitions. Use the toolkit view in
dashboard.composio.devfor authoritative field details.
Transition to Self-Managed Credentials for Select Applications
This is a non-breaking change. Your existing integrations will continue to work as expected. This change only affects new integrations with the applications listed below.
What's Changing?
Starting today, the following applications will require your own developer credentials instead of Composio-managed credentials:
- Auth0
- Blackbaud
- BoldSign
- Deel
- Front
- GoToWebinar
- PagerDuty
- Pipedrive
- Shopify
- Strava
- SurveyMonkey
- Webex
What You Need to Do
To continue using these applications with Composio:
- Create Developer Accounts: Register for developer accounts on the platforms you need
- Generate API Credentials: Create OAuth apps following each platform's documentation
- Configure in Composio: Add your credentials to Composio using custom auth configs
- Test Your Integration: Test your integration with the new credentials
All other Composio applications continue to work with Composio-managed credentials. This change only affects the 12 applications listed above.
Connected Account Expiration for Incomplete Connections
We're implementing automatic expiration for connected accounts that remain in incomplete states, helping maintain a cleaner and more efficient authentication system.
What's Changing?
Connected accounts in Initializing and Initiated states will now automatically expire after 10 minutes. This applies to connection attempts that were started but never completed.
Why This Matters
This change provides:
- Better Resource Management: Automatically cleans up incomplete connection attempts
- Improved System Hygiene: Prevents accumulation of stale, unused connection records
- Enhanced User Experience: Reduces clutter from abandoned authentication flows
This is a non-breaking change. Your existing integrations and completed connections will continue to work as expected. This change only affects connection attempts that are never completed.
Questions?
If you have any questions about this change, please reach out to our support team or check our Connected Accounts documentation.
Required API Key Authentication for MCP URLs
We're strengthening the security of Model Context Protocol (MCP) URLs by making API key authentication mandatory for all requests.
What's Changing?
Starting December 15th, 2025, all new Composio projects must include the x-api-key header when making requests to MCP URLs. This header authenticates your application and ensures secure communication with the Composio platform.
Why This Matters
This change provides:
- Enhanced Authentication: Ensures only authorized applications can access MCP endpoints
- Industry Best Practices: Aligns with standard API security patterns
Impact on Existing Projects
For existing projects: We value backward compatibility and understand the need for a smooth transition. Your existing MCP URLs will continue to work without the x-api-key header until April 15th, 2026.
Important: After April 15th, 2026, all MCP URL requests without the x-api-key header will be rejected. Please ensure you update your applications before this date to avoid service disruption.
Note: If you're already passing the x-api-key header in your MCP requests, no action is required—you're all set!
Migration Guide
To adopt this security enhancement in your existing projects:
- Locate Your API Key: Find your API key in the Composio dashboard under Project Settings
- Update Your Code: Add the
x-api-keyheader to all MCP URL requests - Test Thoroughly: Verify the updated requests work in your development environment
- Deploy: Roll out the changes to your production environment
Questions?
If you have any questions about this security enhancement or need assistance with migration, please reach out to our support team or check our MCP documentation.
Toolkit Version Support for Triggers
Summary
Added toolkit version support to trigger operations (create and getType) in both Python and TypeScript SDKs. This allows users to explicitly specify which toolkit version to use when creating trigger instances and retrieving trigger type information, ensuring consistent behavior across different toolkit versions.
Trigger operations now respect the global toolkitVersions configuration set during Composio initialization, providing better control over which trigger versions are used in your applications.
Key Changes
TypeScript SDK (ts/packages/core/)
- Added
toolkit_versionsparameter totriggers.create()method- Passes the global toolkit versions configuration when creating trigger instances
- Defaults to
'latest'when no version is specified
- Modified
triggers.getType()to respect global toolkit versions- Now accepts toolkit version configuration to fetch trigger types for specific versions
- Improved error messages to include version-related fixes
- Updated trigger type documentation with comprehensive examples
- Added behavior documentation explaining version usage patterns
Python SDK (python/composio/core/models/)
- Added
toolkit_versionsparameter totriggers.create()method- Uses global toolkit version configuration when creating trigger instances
- Converts
Nonetoomitfor API compatibility
- Modified
triggers.get_type()to respect toolkit versions- Implemented custom method replacing direct client binding
- Passes toolkit version configuration to API calls
- Added comprehensive docstrings explaining version behavior
Behavior
Creating Triggers with Toolkit Versions:
// TypeScript - Configure versions at initialization
const composio = new Composio({
  apiKey: 'your-api-key',
  toolkitVersions: {
    gmail: '12082025_00',
    github: '10082025_01'
  }
});

// Create trigger - uses version '12082025_00' for Gmail
const trigger = await composio.triggers.create('user@example.com', 'GMAIL_NEW_MESSAGE', {
  connectedAccountId: 'ca_abc123',
  triggerConfig: {
    labelIds: 'INBOX',
    userId: 'me',
    interval: 60,
  },
});
# Python - Configure versions at initialization
composio = Composio(
api_key="your-api-key",
toolkit_versions={"gmail": "12082025_00", "github": "10082025_01"}
)
# Create trigger - uses version '12082025_00' for Gmail
trigger = composio.triggers.create(
slug="GMAIL_NEW_MESSAGE",
user_id="user@example.com",
trigger_config={"labelIds": "INBOX", "userId": "me", "interval": 60}
)Retrieving Trigger Types with Specific Versions:
// TypeScript
const composio = new Composio({
  apiKey: 'your-api-key',
  toolkitVersions: { github: '10082025_01' }
});

// Get trigger type for specific version
const triggerType = await composio.triggers.getType('GITHUB_COMMIT_EVENT');
// Returns trigger type for version '10082025_01'
# Python
composio = Composio(
api_key="your-api-key",
toolkit_versions={"github": "10082025_01"}
)
# Get trigger type for specific version
trigger_type = composio.triggers.get_type("GITHUB_COMMIT_EVENT")
# Returns trigger type for version '10082025_01'Benefits
- Version Control: Explicitly specify which toolkit version to use for triggers
- Consistency: Ensure trigger behavior remains consistent across toolkit updates
- Testing: Test trigger integrations with specific versions before updating
- Debugging: Easier to debug issues by pinning to specific toolkit versions
- Production Safety: Avoid unexpected changes from automatic version updates
Migration Guide
This is a non-breaking change. Existing code will continue to work with default behavior:
Before (still works):
// Uses 'latest' version by default
const trigger = await composio.triggers.create('user', 'GITHUB_COMMIT_EVENT', {...});
After (recommended for production):
// Explicitly configure versions for better control
const composio = new Composio({
  apiKey: 'your-api-key',
  toolkitVersions: { github: '10082025_01' }
});

const trigger = await composio.triggers.create('user', 'GITHUB_COMMIT_EVENT', {...});
For more details on toolkit versioning, see the Toolkit Versioning documentation.
Enhanced MCP URL Security Requirements
We're introducing improved security requirements for Model Context Protocol (MCP) URLs to ensure better isolation between user connections and prevent unauthorized access.
What's Changing?
Starting today, all new Composio projects must include at least one of the following parameters in their MCP URLs:
user_id- Identifies the specific userconnected_account_id- Identifies the specific connected account
Why This Matters
This change ensures that:
- User Isolation: Each user's connections remain completely separate from others
- Enhanced Security: Prevents potential cross-user data access scenarios
- Better Multi-Tenancy: Enables safer multi-tenant application architectures
- Explicit Access Control: Forces developers to explicitly specify which user or account context they're operating in
Impact on Existing Projects
For existing projects: We understand the importance of backward compatibility. While we've sent email notifications to project owners about upgrading their MCP URLs, your existing integrations will continue to work until January 15th, 2026.
Important: After January 15th, 2026, MCP URLs without user_id or connected_account_id query parameters will no longer be supported. Please ensure you update your MCP URLs before this date to avoid service disruption.
Note: If your MCP URLs already include either user_id or connected_account_id query parameters, no action is required—you can safely ignore this notice.
Implementation Example
Before:
https://dashboard.composio.dev/v3/mcp/{id}After (with user_id):
https://dashboard.composio.dev/v3/mcp/{id}?user_id=user_123After (with connected_account_id):
https://dashboard.composio.dev/v3/mcp/{id}?connected_account_id=ca_xyzMigration Guide
If you're using an existing project and want to adopt this security enhancement:
- Review your current MCP URL configuration
- Add either
user_idorconnected_account_idparameter to your URLs - Update your application code to pass the appropriate identifier
- Test the updated URLs in your development environment
For more details on choosing the right user identifiers for your application, see our session documentation.
Questions?
If you have any questions about this security enhancement or need assistance with migration, please reach out to our support team or check our MCP documentation.
Adds Version Checks for Tool Execution and Improved Execution Speed in TS SDK
Summary
Added version validation for manual tool execution to prevent unexpected behavior when using latest toolkit versions. This ensures users explicitly specify toolkit versions when executing tools manually, while allowing flexibility through a skip flag.
This release also eliminates a lot of redundant API calls made to check connected account during tool execution, effectively increasing the performance of tool execution.
Key Changes
Python SDK (python/)
- Added
ToolVersionRequiredErrorexception with detailed error messages and fix suggestions - Added
dangerously_skip_version_checkparameter toexecute()method - Modified
_execute_tool()to validate version is notlatestunless skip flag is set - Automatically passes
dangerously_skip_version_check=Truefor agentic provider flows - Added comprehensive test coverage (19 test methods) in
test_tool_execution.py
TypeScript SDK (ts/packages/core/)
- Added
ComposioToolVersionRequiredErrorerror class with possible fixes - Added
dangerouslySkipVersionCheckparameter to execute flow - Modified tool execution to validate version before API calls
- Updated execution type definitions in
tool.types.tsandmodifiers.types.ts - Updated test files with date-based version format (
20251201_xx) - Improved tool execution by eliminating redundant API calls
Behavior
Before: Tools could be executed with latest version, risking unexpected behavior on toolkit updates
After: Manual execution requires specific version or explicit skip flag:
# Raises ToolVersionRequiredError
tools.execute("GITHUB_CREATE_ISSUE", {...})

# Works - explicit version
tools.execute("GITHUB_CREATE_ISSUE", {...}, version="20251201_01")

# Works - configured toolkit versions
tools = Tools(client, provider, toolkit_versions={"github": "20251201_01"})

# Works - with skip flag (use cautiously)
tools.execute("GITHUB_CREATE_ISSUE", {...}, dangerously_skip_version_check=True)
Breaking Changes
Manual tool execution without version specification now throws an error. Users must either:
- Pass explicit version parameter
- Configure toolkit versions in SDK initialization
- Set environment variable
COMPOSIO_TOOLKIT_VERSION_<TOOLKIT_SLUG> - Use
dangerously_skip_version_check=Trueflag
MCP (Model Control Protocol) & Experimental ToolRouter
Composio now introduces comprehensive MCP (Model Control Protocol) support and an experimental ToolRouter for creating isolated, scoped sessions with advanced toolkit management. These features enable seamless integration with modern AI frameworks and provide powerful session-based tool routing capabilities.
Why Use MCP & ToolRouter?
- Framework Integration: Native MCP support for Vercel AI, Mastra, OpenAI Agents, and LangChain
- Session Isolation: Create isolated sessions with specific toolkit configurations
- Advanced Authentication: Flexible auth config management per toolkit
- Scoped Access: Control which tools are available within each session
- Multi-Service Workflows: Route tool calls efficiently across different services
- Development & Testing: Perfect for testing and development with scoped MCP server access
TypeScript SDK (v0.1.53)
Added: MCP API
Core MCP Features:
- MCP Server Creation: Create and manage MCP server configurations
- User-Specific URLs: Generate unique MCP server URLs for individual users
- Toolkit Configuration: Support for multiple toolkits with custom auth configs
- Tool Filtering: Specify allowed tools per configuration
- Connection Management: Choose between manual and automatic account management
Basic Usage:
import { Composio } from '@composio/core';

const composio = new Composio({
  apiKey: process.env.COMPOSIO_API_KEY,
});

// Create MCP configuration
const mcpConfig = await composio.mcp.create('my-server-name', {
  toolkits: [
    { toolkit: 'github', authConfigId: 'ac_233434343' },
    { toolkit: 'gmail', authConfigId: 'ac_567890123' }
  ],
  allowedTools: ['GITHUB_CREATE_ISSUE', 'GMAIL_SEND_EMAIL'],
  manuallyManageConnections: false,
});

// Generate server instance for a user
const serverInstance = await composio.mcp.generate('user123', mcpConfig.id);
console.log('MCP URL:', serverInstance.url);
Framework Integration Examples:
// Vercel AI Integration
import { SSEClientTransport } from '@modelcontextprotocol/sdk/client/sse.js';
import { experimental_createMCPClient as createMCPClient } from 'ai';

const mcpClient = await createMCPClient({
  name: 'composio-mcp-client',
  transport: new SSEClientTransport(new URL(serverInstance.url)),
});

// Mastra Integration
import { MCPClient as MastraMCPClient } from '@mastra/mcp';

const mcpClient = new MastraMCPClient({
  servers: {
    composio: { url: new URL(mcpSession.url) },
  },
});

// OpenAI Agents Integration
import { hostedMcpTool } from '@openai/agents';

const tools = [
  hostedMcpTool({
    serverLabel: 'composio',
    serverUrl: mcpSession.url,
  }),
];
Added: Experimental ToolRouter
Core ToolRouter Features:
- Session-Based Routing: Create isolated sessions for specific users and toolkit combinations
- Dynamic Configuration: Configure toolkits and auth configs per session
- MCP Server URLs: Each session gets a unique MCP server endpoint
- Flexible Toolkit Management: Support for string names or detailed toolkit configurations
- Connection Control: Manual or automatic connection management per session
Basic Usage:
// Create session with simple toolkit names
const session = await composio.experimental.toolRouter.createSession('user_123', {
  toolkits: ['gmail', 'slack', 'github'],
});

// Create session with auth configs
const session = await composio.experimental.toolRouter.createSession('user_456', {
  toolkits: [
    { toolkit: 'gmail', authConfigId: 'ac_gmail_work' },
    { toolkit: 'slack', authConfigId: 'ac_slack_team' },
    { toolkit: 'github', authConfigId: 'ac_github_personal' },
  ],
  manuallyManageConnections: true,
});

console.log('Session ID:', session.sessionId);
console.log('MCP URL:', session.url);
Advanced Multi-Service Integration:
// Complex workflow session
const integrationSession = await composio.experimental.toolRouter.createSession('user_789', {
  toolkits: [
    { toolkit: 'gmail', authConfigId: 'ac_gmail_work' },
    { toolkit: 'slack', authConfigId: 'ac_slack_team' },
    { toolkit: 'github', authConfigId: 'ac_github_personal' },
    { toolkit: 'notion', authConfigId: 'ac_notion_workspace' },
    { toolkit: 'calendar', authConfigId: 'ac_gcal_primary' },
  ],
});

// Use with any MCP client
const mcpClient = new MCPClient(integrationSession.url);
Framework-Specific Examples:
// Mastra Integration
const mcpSession = await composio.experimental.toolRouter.createSession(userId, {
  toolkits: ["gmail"],
  manuallyManageConnections: true,
});

const agent = new MastraAgent({
  name: 'Gmail Assistant',
  model: openai('gpt-4o-mini'),
  tools: await mcpClient.getTools(),
});

// OpenAI Agents Integration
const tools = [
  hostedMcpTool({
    serverLabel: 'composio tool router',
    serverUrl: mcpSession.url,
    requireApproval: {
      never: { toolNames: ['GMAIL_FETCH_EMAILS'] },
    },
  }),
];
Python SDK (v0.8.17)
Added: MCP Support
Core MCP Features:
- Server Configuration: Create and manage MCP server configurations
- Toolkit Management: Support for both simple toolkit names and detailed configurations
- Authentication Control: Per-toolkit auth config specification
- Tool Filtering: Specify allowed tools across all toolkits
- User Instance Generation: Generate user-specific MCP server instances
Basic Usage:
from composio import Composio

composio = Composio()

# Create MCP server with toolkit configurations
server = composio.mcp.create(
    'personal-mcp-server',
    toolkits=[
        {
            'toolkit': 'github',
            'auth_config_id': 'ac_xyz',
        },
        {
            'toolkit': 'slack',
            'auth_config_id': 'ac_abc',
        },
    ],
    allowed_tools=['GITHUB_CREATE_ISSUE', 'SLACK_SEND_MESSAGE'],
    manually_manage_connections=False
)

# Generate server instance for a user
mcp_instance = server.generate('user_12345')
print(f"MCP URL: {mcp_instance['url']}")
Simple Toolkit Usage:
# Using simple toolkit names
server = composio.mcp.create(
    'simple-mcp-server',
    toolkits=['composio_search', 'text_to_pdf'],
    allowed_tools=['COMPOSIO_SEARCH_DUCK_DUCK_GO_SEARCH', 'TEXT_TO_PDF_CONVERT_TEXT_TO_PDF']
)

# All tools from toolkits (default behavior)
server = composio.mcp.create(
    'all-tools-server',
    toolkits=['composio_search', 'text_to_pdf']
    # allowed_tools=None means all tools from these toolkits
)
LangChain Integration:
import asyncio
from composio import Composio
from langchain_mcp_adapters.client import MultiServerMCPClient
from langgraph.prebuilt import create_react_agent

composio = Composio()

mcp_config = composio.mcp.create(
    name="langchain-slack-mcp",
    toolkits=[{"toolkit": "slack", "auth_config_id": "<auth-config-id>"}],
)

mcp_server = mcp_config.generate(user_id='<user-id>')

client = MultiServerMCPClient({
    "composio": {
        "url": mcp_server["url"],
        "transport": "streamable_http",
    }
})

async def langchain_mcp(message: str):
    tools = await client.get_tools()
    agent = create_react_agent("openai:gpt-4.1", tools)
    response = await agent.ainvoke({"messages": message})
    return response

response = asyncio.run(langchain_mcp("Show me 20 most used slack channels"))
Added: Experimental ToolRouter
Core ToolRouter Features:
- Session Management: Create isolated tool routing sessions for users
- Toolkit Configuration: Support for both simple toolkit names and detailed configurations
- Session Isolation: Each session gets its own MCP URL and session ID
- Flexible Authentication: Per-session auth config management
- Scoped Tool Access: Control which tools are available within each session
Basic Usage:
from composio import Composio

composio = Composio()

# Create a tool router session
session = composio.experimental.tool_router.create_session(
    user_id='user_123',
    toolkits=['github', 'slack'],
    manually_manage_connections=False
)

print(f"Session ID: {session['session_id']}")
print(f"MCP URL: {session['url']}")
Advanced Configuration:
# Create session with detailed toolkit configurations
session = composio.experimental.tool_router.create_session(
    user_id='user_456',
    toolkits=[
        {
            'toolkit': 'github',
            'auth_config_id': 'ac_github_123'
        },
        {
            'toolkit': 'slack',
            'auth_config_id': 'ac_slack_456'
        }
    ],
    manually_manage_connections=True
)

# Minimal session (no specific toolkits)
session = composio.experimental.tool_router.create_session(
    user_id='user_789'
)
Integration with AI Frameworks:
import asyncio
from composio import Composio
from langchain_mcp_adapters.client import MultiServerMCPClient

composio = Composio()

# Create tool router session
session = composio.experimental.tool_router.create_session(
    user_id='ai_user',
    toolkits=['composio_search', 'text_to_pdf']
)

# Use with LangChain MCP client
client = MultiServerMCPClient({
    "composio": {
        "url": session["url"],
        "transport": "streamable_http",
    }
})

async def use_tool_router():
    tools = await client.get_tools()
    # Use tools in your AI workflow
    return tools

tools = asyncio.run(use_tool_router())
Migration Guide
TypeScript SDK: Migrating to New MCP API
The new MCP API provides enhanced functionality and better integration patterns. Here's how to migrate from the previous MCP implementation:
Before (Legacy MCP)
// Legacy MCP approach (still accessible via deprecated.mcp)
import { Composio } from '@composio/core';

const composio = new Composio();

// Old MCP server creation
const legacyMCP = await composio.deprecated.mcp.createServer({
  name: 'my-server',
  toolkits: ['github', 'gmail'],
});

// Direct URL usage
const mcpUrl = legacyMCP.url;
After (New MCP API)
// New MCP API approach
import { Composio } from '@composio/core';

const composio = new Composio({
  apiKey: process.env.COMPOSIO_API_KEY,
});

// Step 1: Create MCP configuration
const mcpConfig = await composio.mcp.create('my-server', {
  toolkits: [
    { toolkit: 'github', authConfigId: 'ac_github_123' },
    { toolkit: 'gmail', authConfigId: 'ac_gmail_456' }
  ],
  allowedTools: ['GITHUB_CREATE_ISSUE', 'GMAIL_SEND_EMAIL'],
  manuallyManageConnections: false,
});

// Step 2: Generate user-specific server instance
const serverInstance = await composio.mcp.generate('user_123', mcpConfig.id);
const mcpUrl = serverInstance.url;
Key Migration Changes
-
Two-Step Process:
- Before: Single step server creation
- After: Create configuration, then generate user instances
-
Enhanced Configuration:
- Before: Simple toolkit names only
- After: Detailed toolkit configs with auth, tool filtering, connection management
-
User-Specific URLs:
- Before: Single server URL for all users
- After: Unique URLs per user for better isolation
-
Backward Compatibility:
- Legacy Access: Old MCP functionality remains available via
composio.deprecated.mcp - Gradual Migration: Migrate at your own pace without breaking existing implementations
- Legacy Access: Old MCP functionality remains available via
Migration Benefits
- Better Security: User-specific sessions with isolated access
- Enhanced Control: Fine-grained toolkit and tool management
- Framework Integration: Native support for modern AI frameworks
- Scalability: Better resource management and user isolation
Migration Timeline
- Phase 1: New MCP API available alongside legacy implementation
- Phase 2: Legacy MCP accessible via
deprecated.mcpnamespace - Phase 3: Full deprecation (timeline to be announced)
Recommendation: Start new projects with the new MCP API and gradually migrate existing implementations to benefit from enhanced features and better framework integration.
Key Benefits & Use Cases
Development & Testing
- Isolated Environments: Test different toolkit combinations without affecting production
- Scoped Access: Limit tool access for security and testing purposes
- Framework Flexibility: Works with any MCP-compatible client or framework
Production Workflows
- Multi-Service Integration: Seamlessly combine tools from different services
- User-Specific Sessions: Each user gets their own isolated session with appropriate permissions
- Authentication Management: Fine-grained control over authentication per toolkit
Framework Compatibility
- Vercel AI: Native integration with Vercel AI SDK
- Mastra: Full support for Mastra agents and workflows
- OpenAI Agents: Direct integration with OpenAI's agent framework
- LangChain: Complete LangGraph and LangChain compatibility
- Custom Clients: Works with any MCP-compatible client
Enterprise Features
- Session Management: Track and manage multiple user sessions
- Resource Control: Limit concurrent sessions and resource usage
- Audit Trail: Full logging and monitoring of tool usage
- Security: Isolated sessions prevent cross-user data access
Migration & Compatibility
Both MCP and ToolRouter features are designed to complement existing Composio functionality:
// Can be used alongside regular tool management
const regularTools = await composio.tools.get({ toolkits: ['github'] });
const mcpSession = await composio.experimental.toolRouter.createSession(userId, {
  toolkits: ['gmail', 'slack']
});

// Both approaches can coexist and serve different purposes
The experimental ToolRouter API provides a preview of advanced session management capabilities, while the MCP API offers production-ready Model Control Protocol support for modern AI frameworks.
Bug Fixes
Fixed: ToolRouter Dependency Issue
Python SDK (v0.8.19)
Issue Fixed:
- ToolRouter Functionality: Fixed ToolRouter tests that were failing due to missing
tool_routerattribute in HttpClient - Dependency Update: Updated
composio-clientdependency from version 1.9.1 to 1.10.0+ to include ToolRouter functionality - Version Compatibility: Resolved compatibility issues between ToolRouter implementation and client library
Details:
ToolRouter functionality was briefly broken in versions 0.8.15 to 0.8.18 due to a dependency version mismatch. The composio-client library version 1.9.1 did not include the tool_router attribute, causing all ToolRouter integration tests to fail with AttributeError: 'HttpClient' object has no attribute 'tool_router'.
This has been fixed in version 0.8.19 by:
- Updating the
composio-clientdependency to version 1.10.0+ - Ensuring all ToolRouter functionality is now available
- All ToolRouter integration tests now pass successfully
Previous Issue:
# This would fail in versions 0.8.15-0.8.18
session = composio.experimental.tool_router.create_session(user_id='test')
# AttributeError: 'HttpClient' object has no attribute 'tool_router'
Fixed in 0.8.19:
# This now works correctly
session = composio.experimental.tool_router.create_session(user_id='test')
# Returns: {'session_id': '...', 'url': '...'}
Fixed: Missing Descriptions in Auth Config Fields
Python SDK (v0.8.17) & TypeScript SDK (v0.1.53)
Issue Fixed:
- Auth Config Connection Fields: Added missing descriptions to toolkit auth configuration connection fields
- Auth Config Creation Fields: Added missing descriptions to toolkit auth configuration creation fields
- Field Documentation: Improved field documentation and help text for better developer experience
Details: Previously, when developers were setting up auth configurations for toolkits, many fields lacked proper descriptions, making it difficult to understand what information was required. This fix ensures all auth config fields now include:
- Clear, descriptive field labels
- Helpful placeholder text where appropriate
- Detailed explanations of field requirements
This improvement affects all toolkits and makes the authentication setup process more intuitive and error-free.
Toolkit Versioning in SDKs
Composio Toolkit Versioning provides granular control over tool versions across all your integrations. Instead of always using the latest version of tools, developers can now specify exact toolkit versions, ensuring consistent behavior and controlled updates in production environments.
Why Use Toolkit Versioning?
- Version Stability: Pin specific toolkit versions to avoid unexpected changes in production
- Controlled Updates: Test new toolkit versions before deploying to production
- Environment Consistency: Ensure the same toolkit versions across development, staging, and production
- Rollback Capability: Easily revert to previous toolkit versions if issues arise
- Fine-grained Control: Set different versions for different toolkits based on your needs
Python SDK (v0.8.11)
Added
- Toolkit Versioning Support: New
toolkit_versionsparameter for controlling tool versions- Added
toolkit_versionsparameter toComposioclass initialization - Support for global version setting (e.g.,
'latest') - Support for per-toolkit version mapping (e.g.,
{'github': '20250902_00', 'slack': '20250902_00'}) - Environment variable support with
COMPOSIO_TOOLKIT_VERSION_<TOOLKIT_NAME>pattern - New
toolkit_version.pyutility module for version resolution logic
- Added
Examples:
# Global version for all toolkits, only `latest` is supported
composio = Composio(toolkit_versions='latest')

# Per-toolkit version mapping
composio = Composio(toolkit_versions={
    'github': '20250902_00',
    'slack': '20250902_00',
    'gmail': '20250901_01'
})

# Using environment variables
# Set COMPOSIO_TOOLKIT_VERSION_GITHUB=20250902_00
composio = Composio()  # Automatically picks up env vars

# Get tools with specific versions
tools = composio.tools.get('default', {'toolkits': ['github']})
TypeScript SDK (v0.1.52)
Added
- Toolkit Versioning Support: Added
toolkitVersionsconfiguration option- New
toolkitVersionsparameter inComposioclass constructor - Support for global version string or per-toolkit version mapping
- Environment variable parsing with
getToolkitVersionsFromEnv()utility - Enhanced
getRawComposioToolBySlug()method for version-specific tool retrieval - Version-aware tool filtering and search capabilities
- New
Examples:
// Global version for all toolkits
const composio = new Composio({
  toolkitVersions: '20250902_00'
});

// Per-toolkit version mapping
const composio = new Composio({
  toolkitVersions: {
    'github': '20250902_00',
    'slack': '20250902_00',
    'gmail': '20250901_01'
  }
});

// Using environment variables
// Set COMPOSIO_TOOLKIT_VERSION_GITHUB=20250902_00
const composio = new Composio(); // Automatically picks up env vars

// Get specific tool version
const tool = await composio.tools.getRawComposioToolBySlug(
  'GITHUB_GET_REPO',
);

// Get tools with version-aware filtering
const tools = await composio.tools.get('default', {
  toolkits: ['github'],
  limit: 10
});
Key Benefits
- Environment Variables: Set
COMPOSIO_TOOLKIT_VERSION_<TOOLKIT_NAME>=<VERSION>for automatic version resolution - Flexible Configuration: Choose between global versions or per-toolkit version mapping
- Backward Compatibility: Existing code works unchanged - versioning is opt-in
- Version Fallback: Automatically falls back to 'latest' when no version is specified
- Cross-Platform Consistency: Identical developer experience across Python and TypeScript
Version Format
Toolkit versions follow the format: YYYYMMDD_NN (e.g., 20250902_00) or use 'latest' for the most recent version only supported at global scope and not individual toolkit level.
Environment Variables
# Set specific versions for different toolkits
export COMPOSIO_TOOLKIT_VERSION_GITHUB=20250902_00
export COMPOSIO_TOOLKIT_VERSION_SLACK=20250902_00
export COMPOSIO_TOOLKIT_VERSION_GMAIL=20250901_01
Migration Note
This feature is fully backward compatible. Existing code will continue to work without changes, using the latest versions by default. To enable versioning, simply add the toolkit_versions parameter during SDK initialization.
Additional Updates
- Package Updates: Bumped all Python provider packages to v0.8.10
- Documentation: Enhanced API documentation with versioning examples
- Testing: Added comprehensive test coverage (400+ new test cases) for versioning functionality
- Examples: New versioning examples demonstrating practical usage patterns
Introducing Composio Auth Links
Composio Auth Links provide a hosted authentication solution that eliminates the need for developers to build custom authentication forms. Instead of manually rendering OAuth consent screens, API key input forms, or custom authentication fields, developers can simply redirect users to a Composio-hosted URL that handles the entire authentication process automatically.
Why Use Auth Links?
- Zero UI Development: No need to build forms for OAuth, API keys, or custom fields like subdomains
- Universal Authentication: Works seamlessly across all supported third-party services
- Reduced Complexity: Replace complex OAuth flows with a simple redirect
- Better UX: Professional, consistent authentication experience for end users
- Faster Integration: Get authentication working in minutes, not hours
Python SDK (v0.8.11)
Added
- Composio Connect Link Support: New
link()method for creating external authentication links- Added
link()method toConnectedAccountsclass for generating user authentication links - Support for callback URL redirection after authentication
- Enhanced user experience with external link-based authentication flow
- No manual form rendering required - Composio handles all authentication UI
- Added
Examples:
# Basic usage - create a connection request
connection_request = composio.connected_accounts.link('user_123', 'auth_config_123')
redirect_url = connection_request.redirect_url
print(f"Visit: {redirect_url} to authenticate your account")

# Wait for the connection to be established
connected_account = connection_request.wait_for_connection()

# With callback URL
connection_request = composio.connected_accounts.link(
    'user_123',
    'auth_config_123',
    callback_url='<https://your-app.com/callback>'
)
TypeScript SDK (v0.1.51)
Added
- Composio Connect Links: Added support for composio connect links
- New
link()method inConnectedAccountsclass for generating authentication URLs - Support for callback URL redirection with
CreateConnectedAccountLinkOptions - Comprehensive TypeScript types and validation for link creation options
- Eliminates need for custom authentication forms - just redirect users to the link
- New
Examples:
// Basic usage - create a connection request
const connectionRequest = await composio.connectedAccounts.link('user_123', 'auth_config_123');
const redirectUrl = connectionRequest.redirectUrl;
console.log(`Visit: ${redirectUrl} to authenticate your account`);

// Wait for the connection to be established
const connectedAccount = await connectionRequest.waitForConnection();

// With callback URL
const connectionRequest = await composio.connectedAccounts.link('user_123', 'auth_config_123', {
  callbackUrl: '<https://your-app.com/callback>'
});
Key Benefits
- No Form Building: Composio handles OAuth consent, API key collection, and custom field inputs
- Hosted Authentication Flow: Professional UI that works across all supported services
- Callback URL Support: Control where users return after successful authentication
- Connection Waiting: Built-in polling to detect when authentication completes
- Cross-Platform Consistency: Identical developer experience across Python and TypeScript
Customisation
You can customise the app logo and name showed in the authentication page via the dashboard. Head over your project via dashboard.composio.dev and choose Settings → Auth Links to upload a new logo and change the name.
Migration Note
This feature replaces manual authentication form development with a simple redirect-based approach, significantly reducing integration time and complexity while providing a better user experience. Auth links are drop in replacement for composio.connectedAccounts.initate, you can safely swap this to composio.connectedAccounts.link